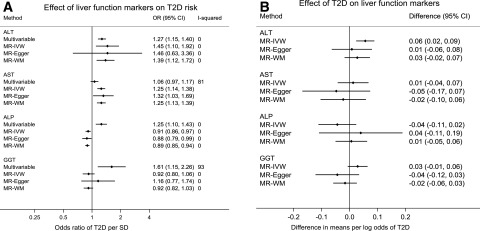
Figure 2.
Multivariable and MR analysis of the effect of liver function on T2D (A) and MR analysis of the effect of T2D on liver function markers (B). Results from Fig. 1A correspond to OR of T2D per unit increase in standardized liver function markers (and 95% CI). Results from Fig. 1B correspond to change in standardized liver function markers per unit increase in log odds of T2D (and 95% CI). I-squared indicates between-study heterogeneity and is only presented when estimates for more than one study were available.

