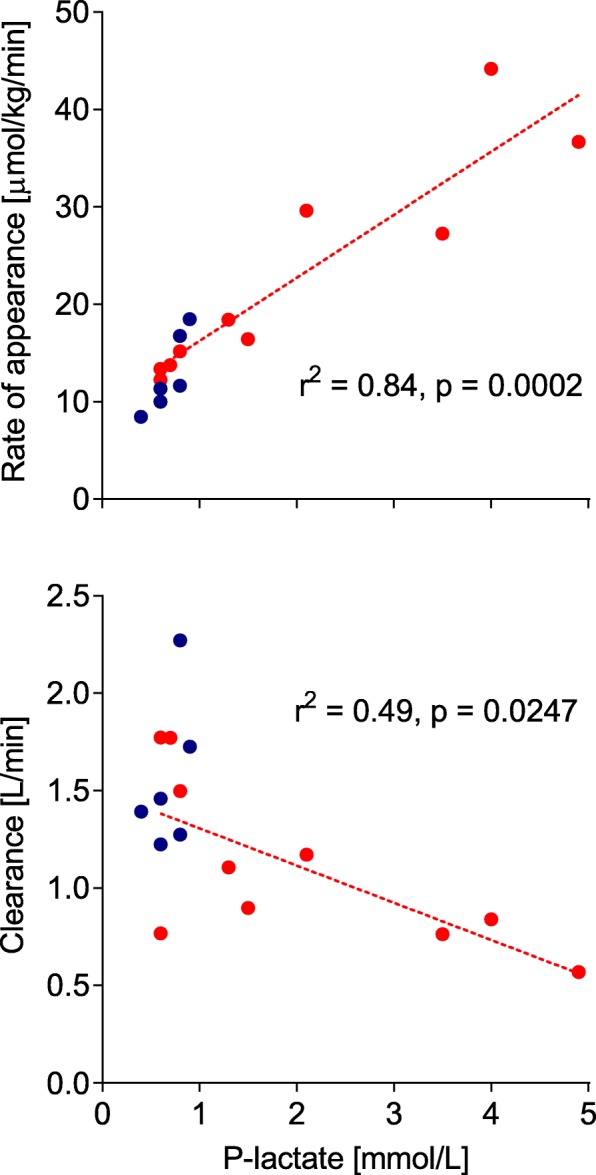
Fig. 2.

Relationship between plasma concentration and rate of appearance and clearance of lactate. Relation between plasma lactate concentrations and rate of appearance of lactate (upper panel) and metabolic clearance of lactate (bottom panel) as calculated from a bolus dose of 13C-labeled lactate in healthy volunteers (blue circles, n = 6) and ICU patients (red circles, n = 10). The lines of regression and associated statistics apply to the group of ICU patients only
