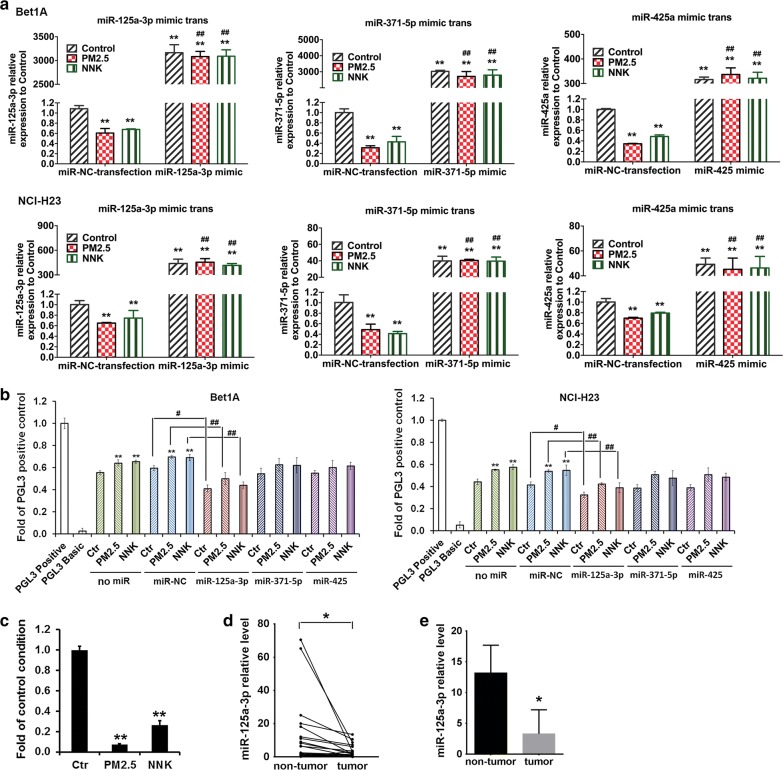
Fig. 5.
TCTP transcriptional activity was negatively regulated by miRNA. a Overexpression of miR-125a-3p, miR-371a-5p, and miR-425 in PM2.5- or NNK-induced lung cells. Bet1A cells or NCI-H23 cells were treated with PM2.5 or NNK for 28 days. Then the cells were transfected with miR-125a-3p mimic, miR-371a-5p mimic, miR-425 mimic, and miR-NC control respectively for 24 h. Total RNA was extracted for real-time PCR assay. The values indicate the mean ± SD of three independent experiments. (*p < 0.05 and **p < 0.01 vs miR-NC control. #p < 0.05 and ##p < 0.01 vs miR-NC + PM2.5 or miR-NC + NNK respectively. b TCTP transcriptional activity was downregulated by miR-125a-3p. Bet1A cells and NCI-H23 cells were treated with PM2.5 or NNK for 28 days and were con-transfected with miR-125a-3p mimic, miR-371a-5p mimic, miR-425 mimic, and miR-NC respectively with luciferase reporter constructs containing the pGL3-TCTP 3′-UTR. The pGL3 basic vector and the pGL3 control were used as negative and positive controls respectively. Reporter assays were performed using the Dual-luciferase assay system, normalized for transfection efficiency by co-transfected Renilla luciferase. Data are expressed as mean ± SD of three independent experiments performed in triplicate. **p < 0.01 vs no miR control. #p < 0.05 and ##p < 0.01, when compared between indicated groups. c miR-125a-3p expression in the xenografts of NCI-H23 cells. In the CDX experiment, three of each group of tumor tissue RNA from the mice was pooled together and miR-125a-3p expression in the xenografts of NCI-H23 cells was detected by Real-time PCR. The values indicate the mean ± SD of three independent experiments, **p < 0.01 vs control group. d, e The levels of miR-125a-3p in 20 paired NSCLC tissues and adjacent normal tissues. MiR-125a-3p expression in the human lung tumor tissues and paired non-tumor tissues was examined by Real-time PCR. ( was paired t-test result to compare the miR-125a-3p expression between tumor tissues and non-tumor tissues (*p < 0.05), and e was unpaired t-test result to compare the mean of miR-125a-3p expression between tumor tissues and non-tumor tissues as data were expressed as mean ± SE (*p < 0.05)

