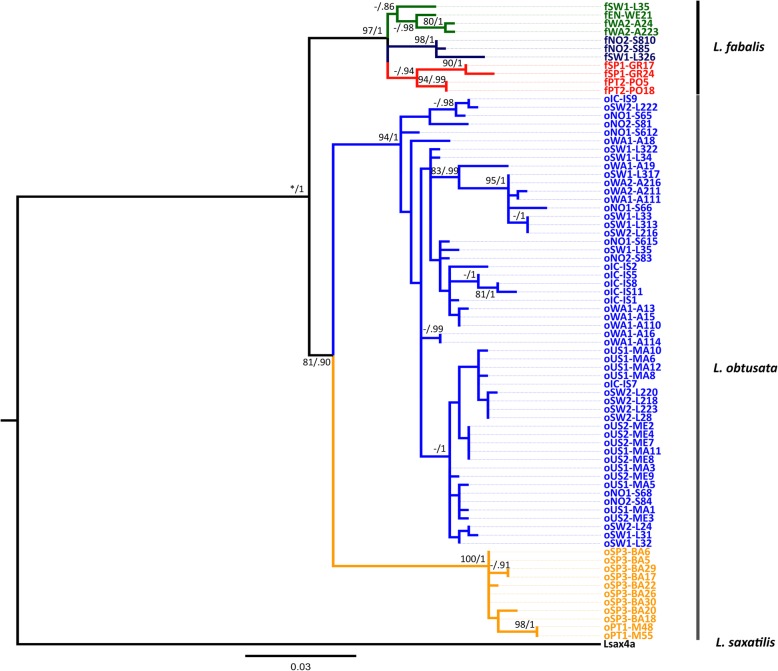
Fig. 2.
Maximum likelihood (ML) tree for all genes concatenated (mt + nuDNA; 2222 bp). Numbers on branches represent bootstrap values equal to or over 80% for ML (left) and posterior probabilities equal to or over 0.90 for BI (right). (*) Support value not provided by the ML method. The tree was rooted with L. saxatilis. Colors refer to lineages, roughly in agreement with geography. For L. fabalis, Iceland, Norway, Sweden, Shetlands are indicated in dark blue; UK, Ireland, France, in dark green; and Iberian Peninsula, in dark orange. For L. obusata, Iberian Peninsula is indicated in light orange and all remaining samples (USA, Iceland, Norway, Sweden, Shetlands, UK), in light blue

