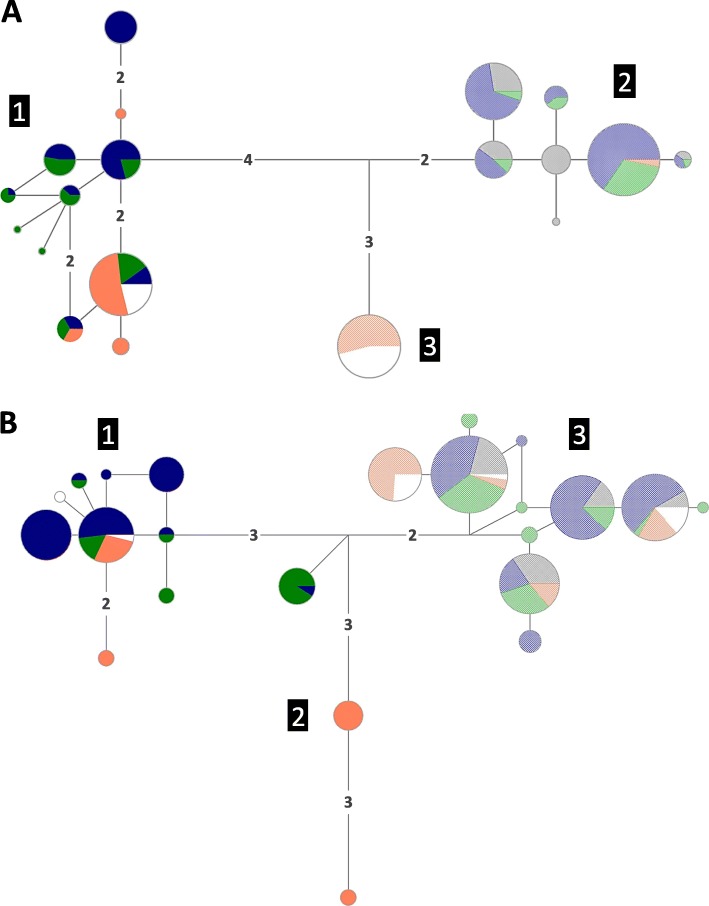
Fig. 3.
Median-Joining (MJ) haplotype networks for each nuclear gene. a Thio. b Cal. Circle areas are proportional to allele/haplotype frequency. Numbers on branches indicate substitution steps between alleles/haplotypes (when more than one). Pie chart fillings correspond to species: solid colored circles – L. fabalis; low-transparency colored circles – L. obtusata. Individuals from Cabo do Mundo (admixed) are represented in white. The remaining colors refer to lineages, roughly in agreement with geography (North America – grey; Iceland, Norway, Sweden, Shetlands – blue; UK, Ireland, France – green; Iberian Peninsula – orange). Numbers within black squares indicate lineages

