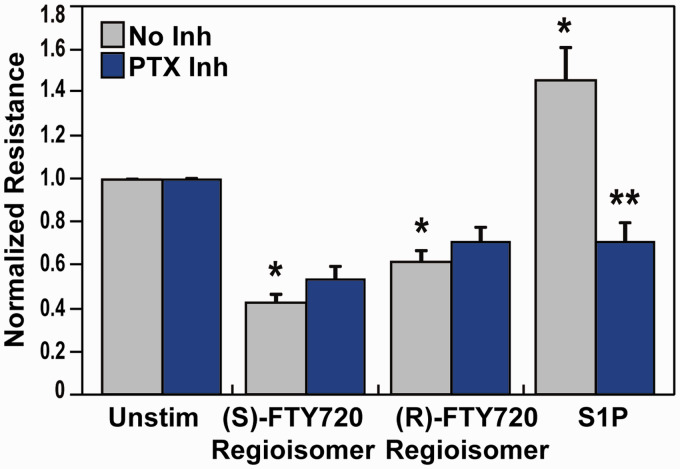
Fig. 3.
Effect of G protein inhibition on (S)- and (R)-FTY720 regioisomer-induced barrier disruption. HPAEC were plated on gold microelectrodes for TER measurements as described in the Methods section. Bar graphs depict pooled TER data from HPAEC pre-treated for 4 h with no inhibitor (grey) or pertussis toxin (PTX, 100 ng/ml, blue), then stimulated with (S)- FTY720 regioisomer (10 µM), (R)-FTY720 regioisomer (10 µM), or S1P (1 µM) as indicated. The data are expressed as change in TER, compared to normalized unstimulated or inhibitor only controls, at 6 h ((S)- and (R)-FTY720 regioisomers) or 10 min (S1P) after agonist stimulation (±S.E.M.). Normalized resistance values over 1 indicate barrier enhancement. Normalized resistance values under 1 indicate barrier disruption. n = 5 independent experiments per condition; *p < 0.01 agonist alone versus unstimulated cells; p < 0.01 agonist with inhibitor pretreatment versus agonist alone.
S1P: sphingosine-1-phosphate; FTY720: 2-amino-2-(2-[4-octylphenyl]ethyl)-1,3-propanediol.

