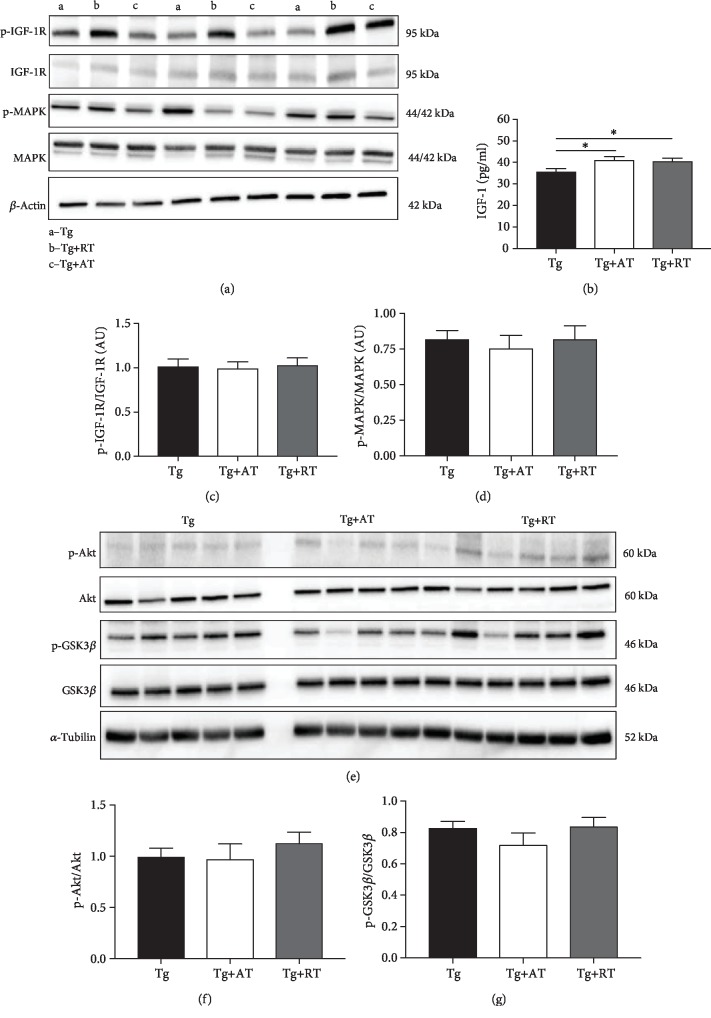
Figure 5.
IGF-1 expression and signaling in the hippocampus of exercise-trained 3xTg-AD mice. (a) Representative immunoblots for IGF-1R and MAPK. (b) IGF-1 concentration in hippocampal homogenate measured by ELISA. (c) p-IGF-1R normalized to total IGF-1R. (d) p-MAPK normalized to MAPK. (e) Representative immunoblots for Akt and GSK3β. (f) p-Akt normalized to Akt. (g) p-GSK3β normalized to total GSK3β. Data presented as mean ± SE. Tissues assayed from the nonexercised group (Tg), the aerobic-trained group (Tg+AT), or the resistance-trained group (Tg+RT) (n = 10/group). Differences determined by one-way ANOVA. ∗p < 0.05 and ∗∗p < 0.01.

