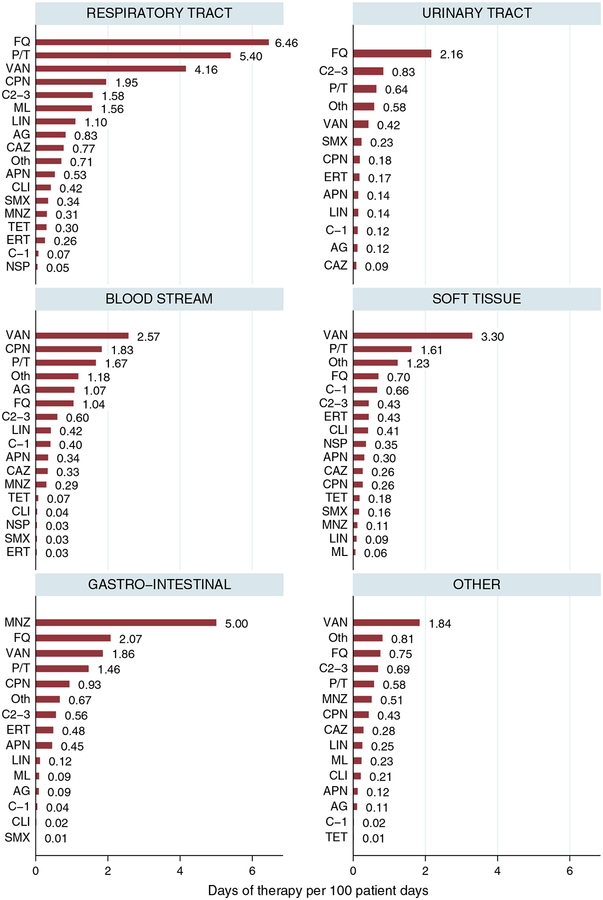
FIGURE 2.
Therapeutic antibiotic use by infection site, expressed in days of therapy per 100 patient-days. Bars show the number of days of therapy per 100 patient-days (N = 2,527 prescriptions, 1,200 patients). AG, aminoglycosides; APN, aminopenicillins; C1–3, first- to third-generation cephalosporins, CAZ, ceftazidime and cefepime; CPN, carbapenems (excluding ertapenem); ERT, ertapenem; FQ, fluoroquinolones; LIN, linezolid; ML, macrolides; MNZ, metronidazole; NSP, narrow-spectrum penicillins; P/T, antipseudomonal penicillins; SMX, sulfonamides; TET, tetracyclines; VAN, vancomycin; Oth, other (includes daptomycin, tigecycline, nitrofurantoin, and colistin).

