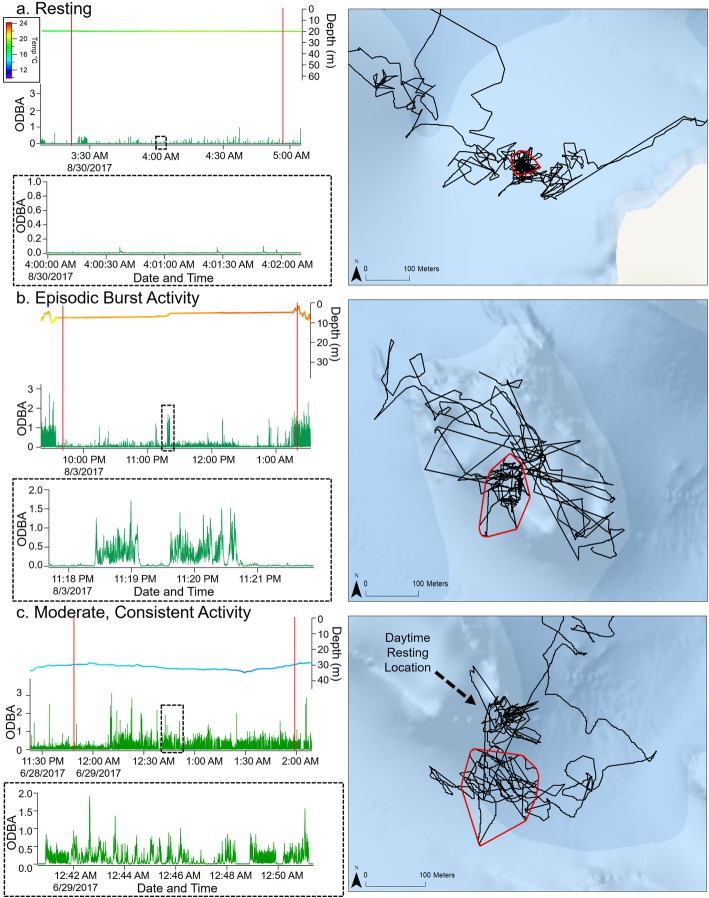
Fig. 4.
First passage time (FPT) analysis results showing area restricted search (ARS) patches for California horn sharks and corresponding acceleration signatures within each patch. Examples are of a resting, b episodic burst activity, and c moderate, consistent, activity. Acceleration signals include the depth trace colored by temperature, ODBA (green), and a zoomed in representation of the ODBA signal observed. Black traces on the maps are the movement paths. Red vertical lines denote the times within the patch circled in red on the maps. The part of the trace that looks like patch activity in the map in (c) is that individual’s daytime resting position, so it was not identified as a patch in the FPT analysis

