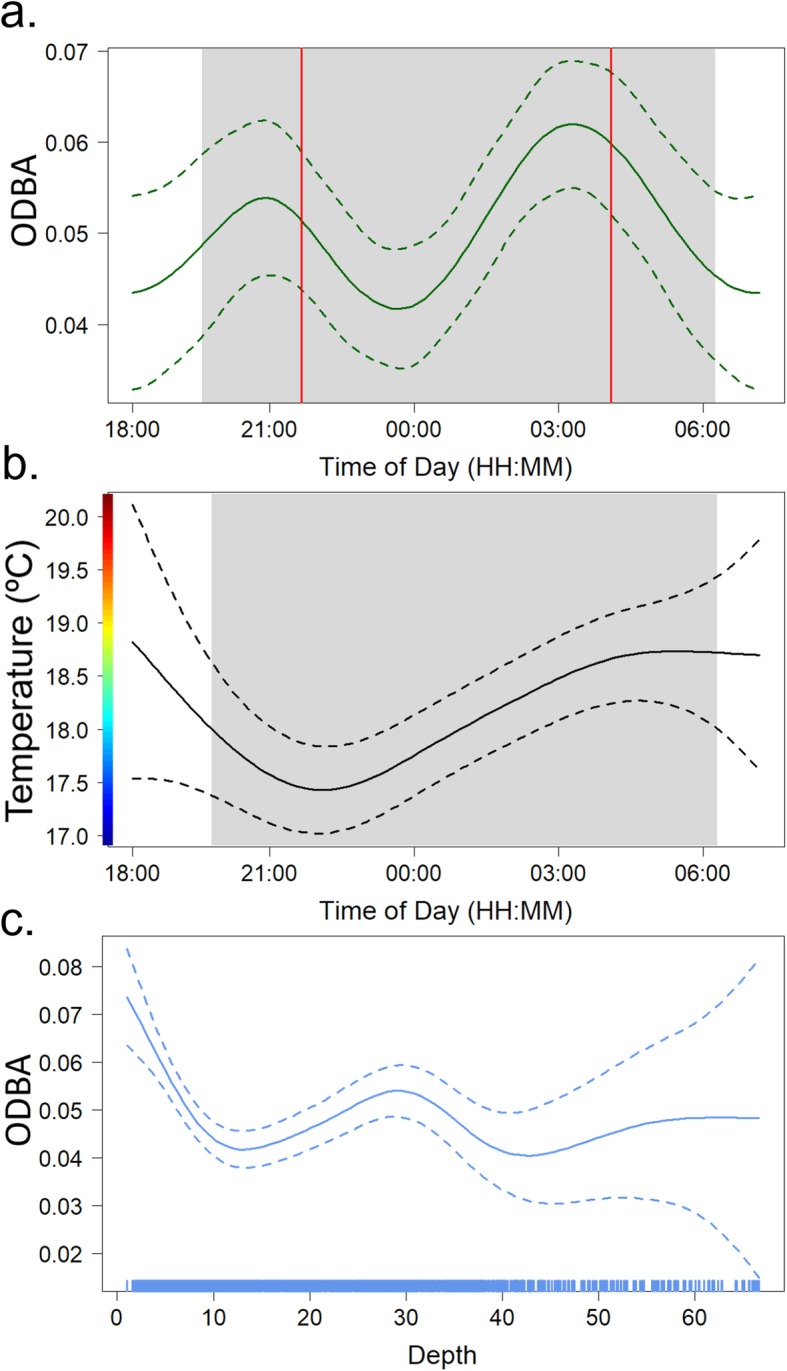
Fig. 5.

Hourly and environmental effects on California horn shark nighttime activity (ODBA) using general additive mixed models (GAMMs). Nighttime patterns in shark activity (a) and environmental temperature (b) calculated using 5 min means. Gray boxes denote median local sunset (19:43 PST) and local sunrise (06:14 PST) times from all active tracks. Red vertical lines (a) denote the median patch arrival (21:40 PST) and patch departure (04:03 PST) times from first passage time (FPT) analysis. c Horn shark activity was significantly influenced by what depth (m) the shark was at (Shark 06 removed from this analysis as an outlier). The blue rug in (c) indicates the spread of samples across the depths. Dashed lines (a, b, c) indicate the 95% confidence interval around each smooth term
