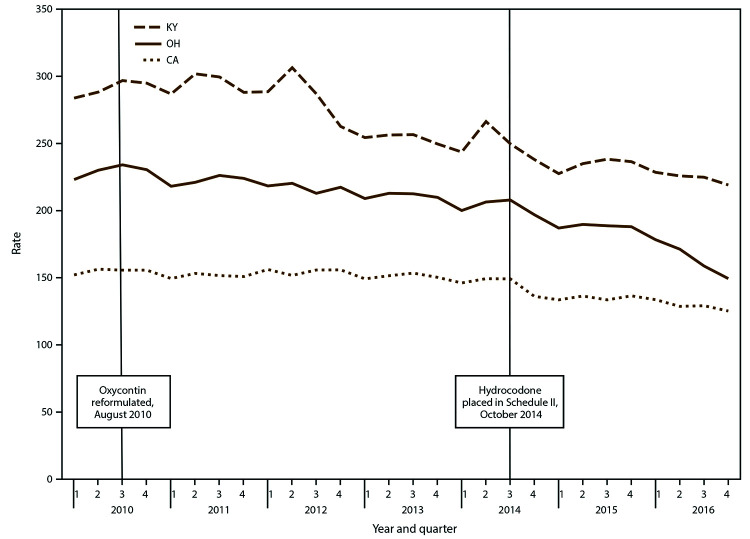
FIGURE 1.
Opioid prescribing rate,* by selected states† and quarter — Prescription Behavior Surveillance System, 2010-2016§,¶
Abbreviations: CA = California; KY = Kentucky; OH = Ohio.
* Opioid prescribing rate is defined as the total number of Drug Enforcement Administration Schedule II-V opioid prescriptions dispensed during the quarter in the state per 1,000 state residents.
† Includes selected states with data during 2010–2016 that represented the highest, lowest, and middle rates for each measure. These states were selected to depict the range of values found across the states in the study.
§ The statistical significance of average quarterly percent changes was measured using 95% confidence intervals. The average quarterly percent change over the time period shown was statistically significant (p<0.05) for California, Kentucky, and Ohio.
¶ Number of Joinpoints: California = one, Kentucky = two, Ohio = two.

