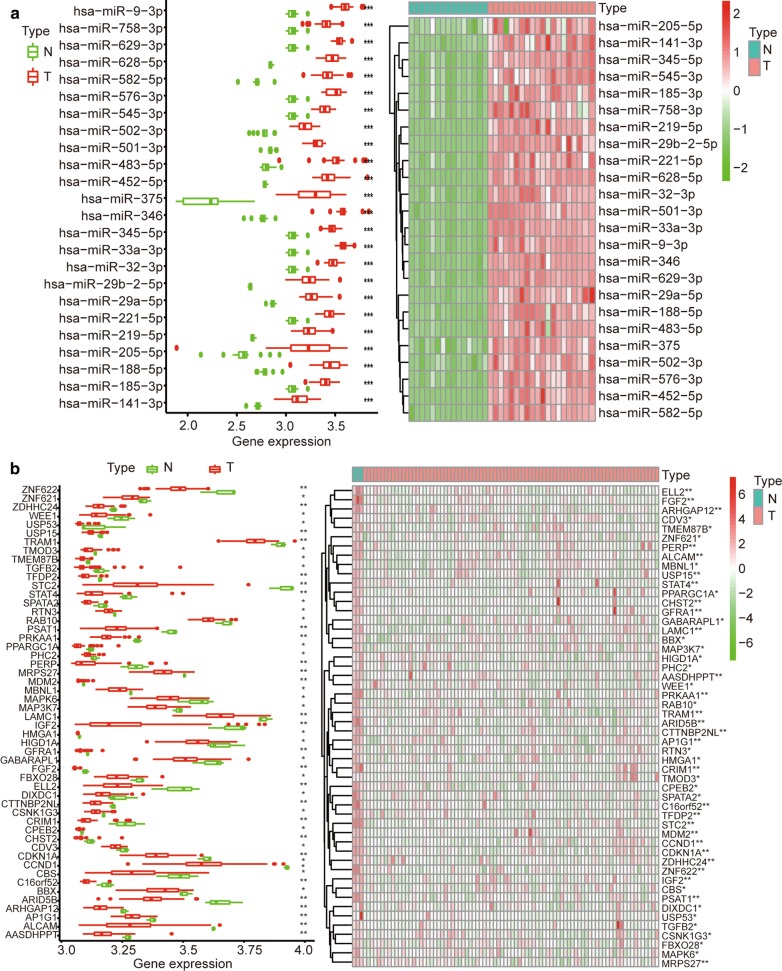
Fig. 4.
The differentially expressed miRNAs and mRNAs in the microarray datasets. a Twenty-four miRNAs were obtained from the intersection of miRNAs predicted from the website and the differentially expressed miRNAs identified in the miRNA dataset (GEO dataset). The expression levels of 24 miRNAs in the miRNA dataset are shown in a. b A total of 52 differentially expressed mRNAs were obtained by analysing the mRNA dataset and predicting the targeted binding of genes by the 24 miRNAs. The expression levels of these 52 mRNAs in the mRNA dataset are shown in b. (|log 2 (fold change (FC))| > 2, and an adjusted P value < 0.05 were the cut-off criteria). *P < 0.05, **P < 0.01, ***P < 0.001

