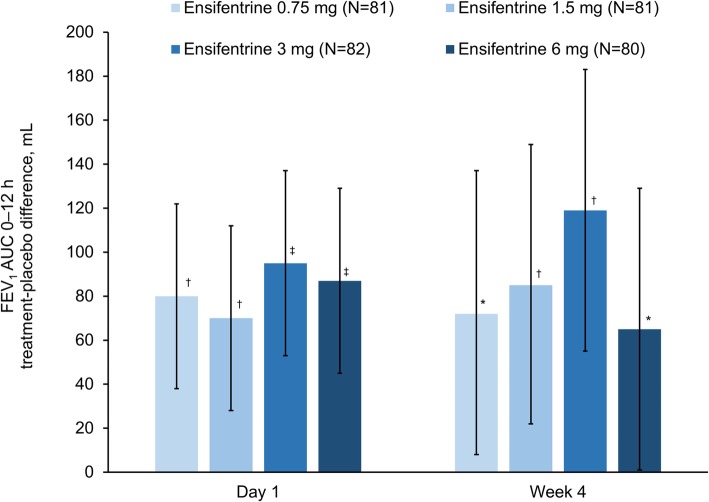
Fig. 5.
Average FEV1 over 0–12 h (full analysis set). Data are least squares means treatment–placebo differences and 95% confidence intervals. *p < 0.05; †p < 0.01; ‡p < 0.001 vs placebo. Least squares mean changes from baseline in the placebo group (N = 79) were 8 and −33 mL on Day 1 and at Week 4, respectively. Abbreviation: FEV1, forced expiratory volume in 1 s

