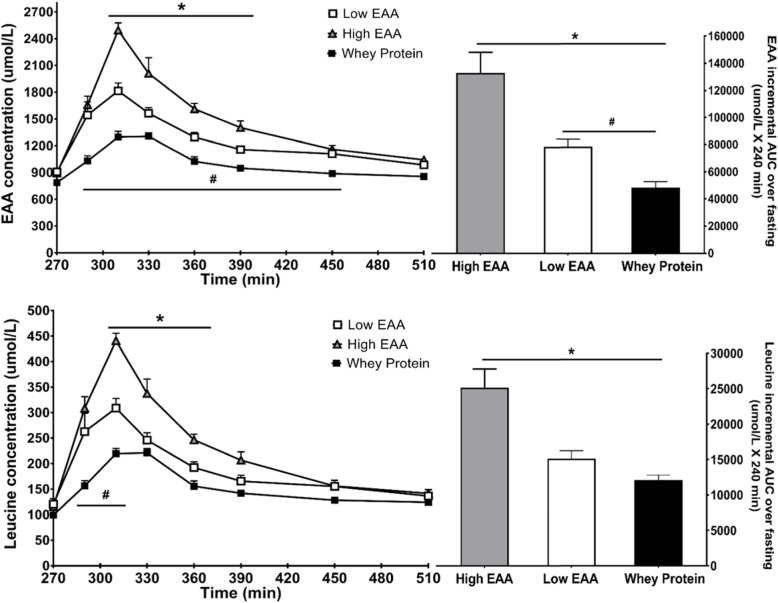
Fig. 2.
Total plasma essential amino acid (EAA) concentration (upper panel) and leucine concentration (lower panel) before and following consumption of one of two doses (6.3 g and 12.6 g) of the free EAA/protein composition or the whey protein product (17.9 g). Bar graphs on right represent the area under the curve for the response above baseline over the 4 h following consumption of each dose of free EAAs/protein and of whey protein. *Statistically different from High EAA, p < 0.05; #Statistically different between Low EAA and whey protein, p < 0.05

