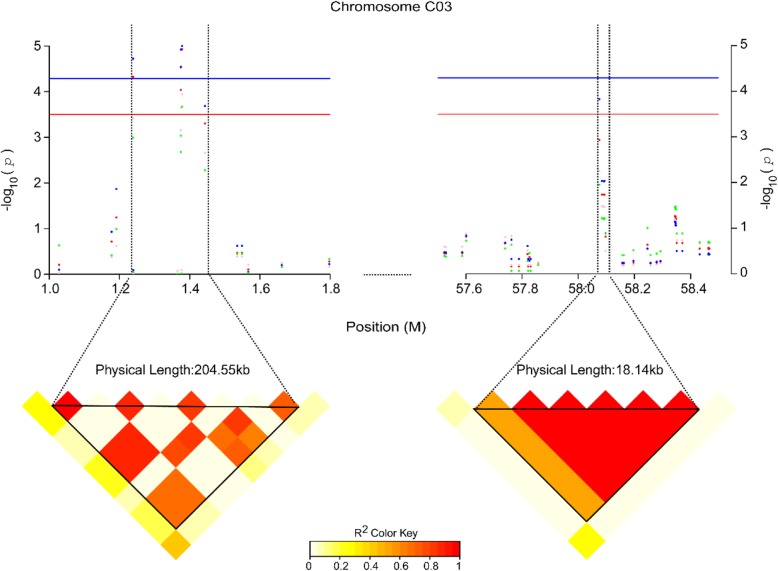
Fig. 4.
Association mapping for RRL on chromosome C03. Plots show the SNPs in the QTL Pb-C03–1 (top left of Fig. 4, from 1,241,778 to 1,446,328 bp on chromosome C03) and Pb-C03–2 (top right of Fig. 4, from 58,079,114 to 58,097,249 bp on chromosome C03) regions associated with RRL. The red, pink, blue and green dots represent the association signals for RRL_Means (average value of three RRLs), RRL1 (RRL in replication 1), RRL2 (RRL in replication 2) and RRL3 (RRL in replication 3), respectively. The blue and red horizontal line indicate the threshold of significantly associated SNPs at −log10 (1/19,945) = 4.3 and threshold of moderately associated SNPs at 3.5 ≤ −log10 (p) ≤ 4.3, respectively as in Fig. 2. The heat maps span the linkage disquilibrium (LD) region with the most strongly associated SNPs (r2 > 0.4)

