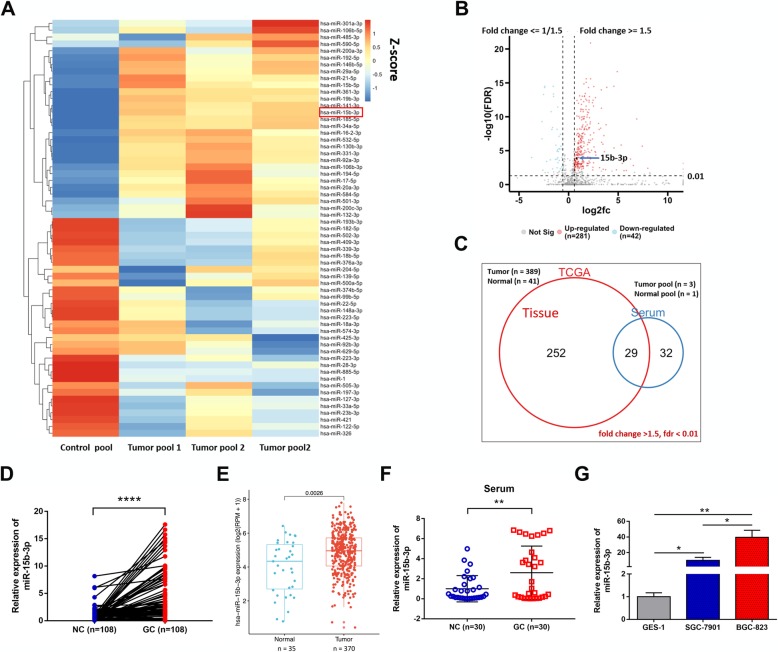
Fig. 1.
Increased expression of miR-15b-3p in GC. a. Heat map showing the miRNA expression profile, and the top 61 significantly upregulated miRNAs in the GC samples are listed. b. The volcano plot shows the difference between miRNAs in the tissues of healthy individuals and GC patients in the TCGA database. The miRNAs were classified based on fold change (log2fc) between the two groups. c. Venn diagram shows that the 29 miRNAs are significant highly expressed in both GC tissue (according to TCGA database) and microarray sequencing results. d. qRT-PCR analysis of has-miR-15b-3p expression by in 108 GC tissues and paired adjacent non-GC tissues. e. has-miR-15b-3p expression was found to be statistically significant in GC tissues of the TCGA database. f. GC patient serum and healthy volunteer (n = 30) serum miR-15b-3p levels were analyzed using qRT-PCR. g. qRT-PCR was used to detect miR-15b-3p expression in BGC-823, SGC-7901 and GES-1 cells. Mean ± SEM of the results are presented

