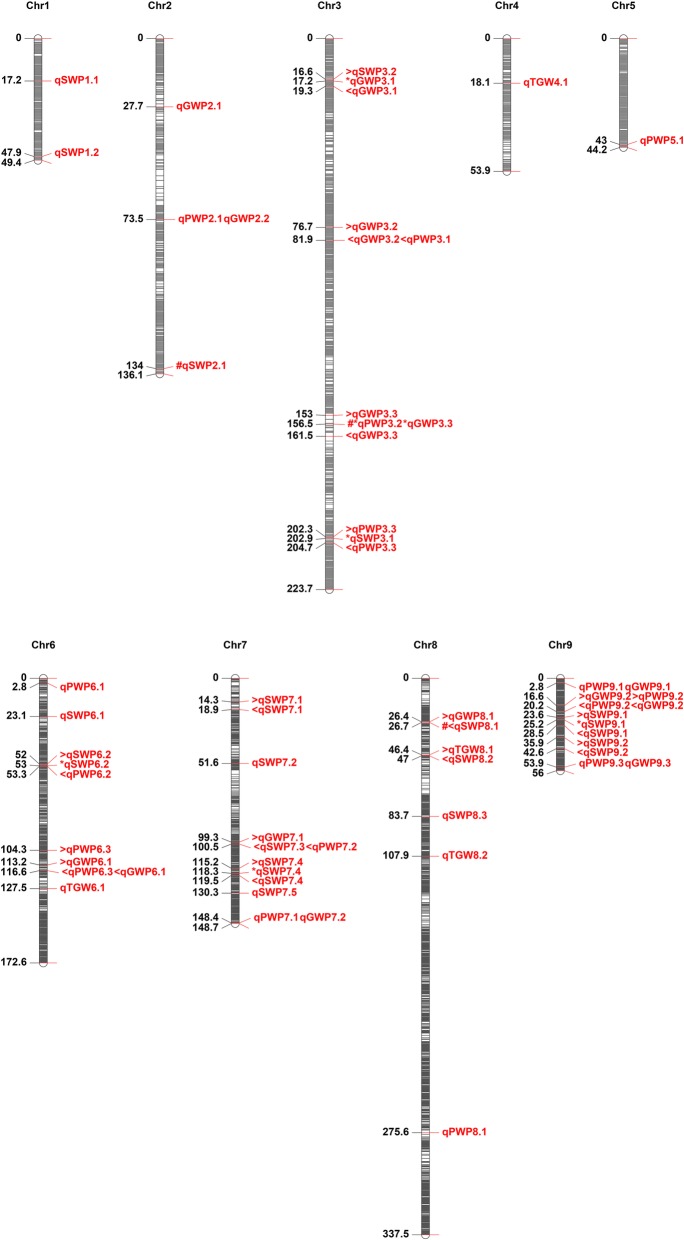
Fig. 3.
QTL controlling yield component traits on nine chromosomes. The color intensity of the bar chart represents the marker density. The number on the left indicates the genetic distance in centimorgan (cM). On each chromosome, the name of each QTL is shown on the right. Parallel QTLs indicate the same location on the chromosome. The symbol’<, *, >’ in front of the QTL represent partial overlap with the QTL above, the both flanking QTL and the QTL below region, respectively. The symbol’#’ in front of the QTL represents the same QTL identified under two environments. QTL were identified for four yield traits and shown as straw weight per plant (SWP), panicle weight per plant (PWP), grain weight per plant (GWP), and 1000-grain weight (TGW)

