Fig. 7.
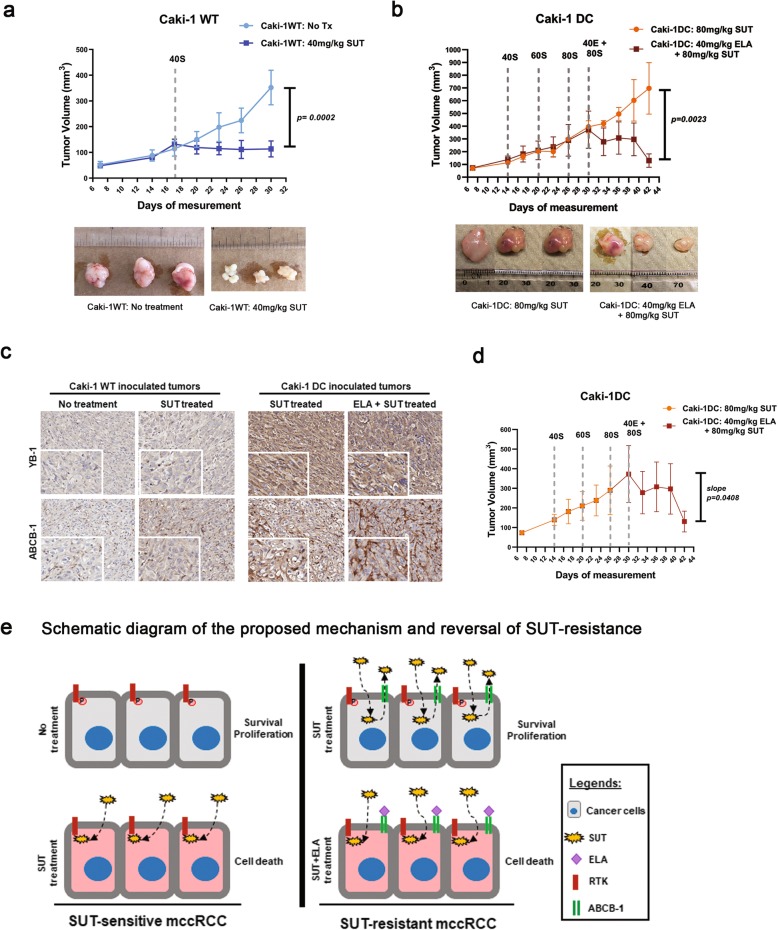
In vivo study using out sunitinib-resistant mccRCC mouse model. a Mice with Caki-1WT tumor responded to low dose of SUT (40 mg/kg, dark blue line) compared to vehicle treated mice (light blue line). b Caki-1 DC tumors kept growing while on SUT treatment and the dose escalated (40 mg/kg to 80 mg/kg, orange line). The tumor continued to grow in high dose of SUT therapy but the size decreased with the 80 mg/kg SUT with 40 mg/kg ELA combination therapy (red line). c Immunohistochemical staining of Caki-1WT and DC tumors for YB-1 and ABCB-1. d A graph comparing the rate of tumor growth (slope) within the same group of mice injected with Caki-1 DC that received combination therapy. The rate of tumor growth substantially decreased with the initiation of combination therapy compared to monotherapy in the same animals. e Schematic diagram of our proposed mechanism of sunitinib-resistance development and a, potential, therapy option to overcome sunitinib-resistance. SUT: sunitinib. ELA: elacridar. Data as mean ± SEM, n = 5–6 animals/group.*p < 0.05, **p < 0.005, ***p < 0.0005, ****p < 0.0001

