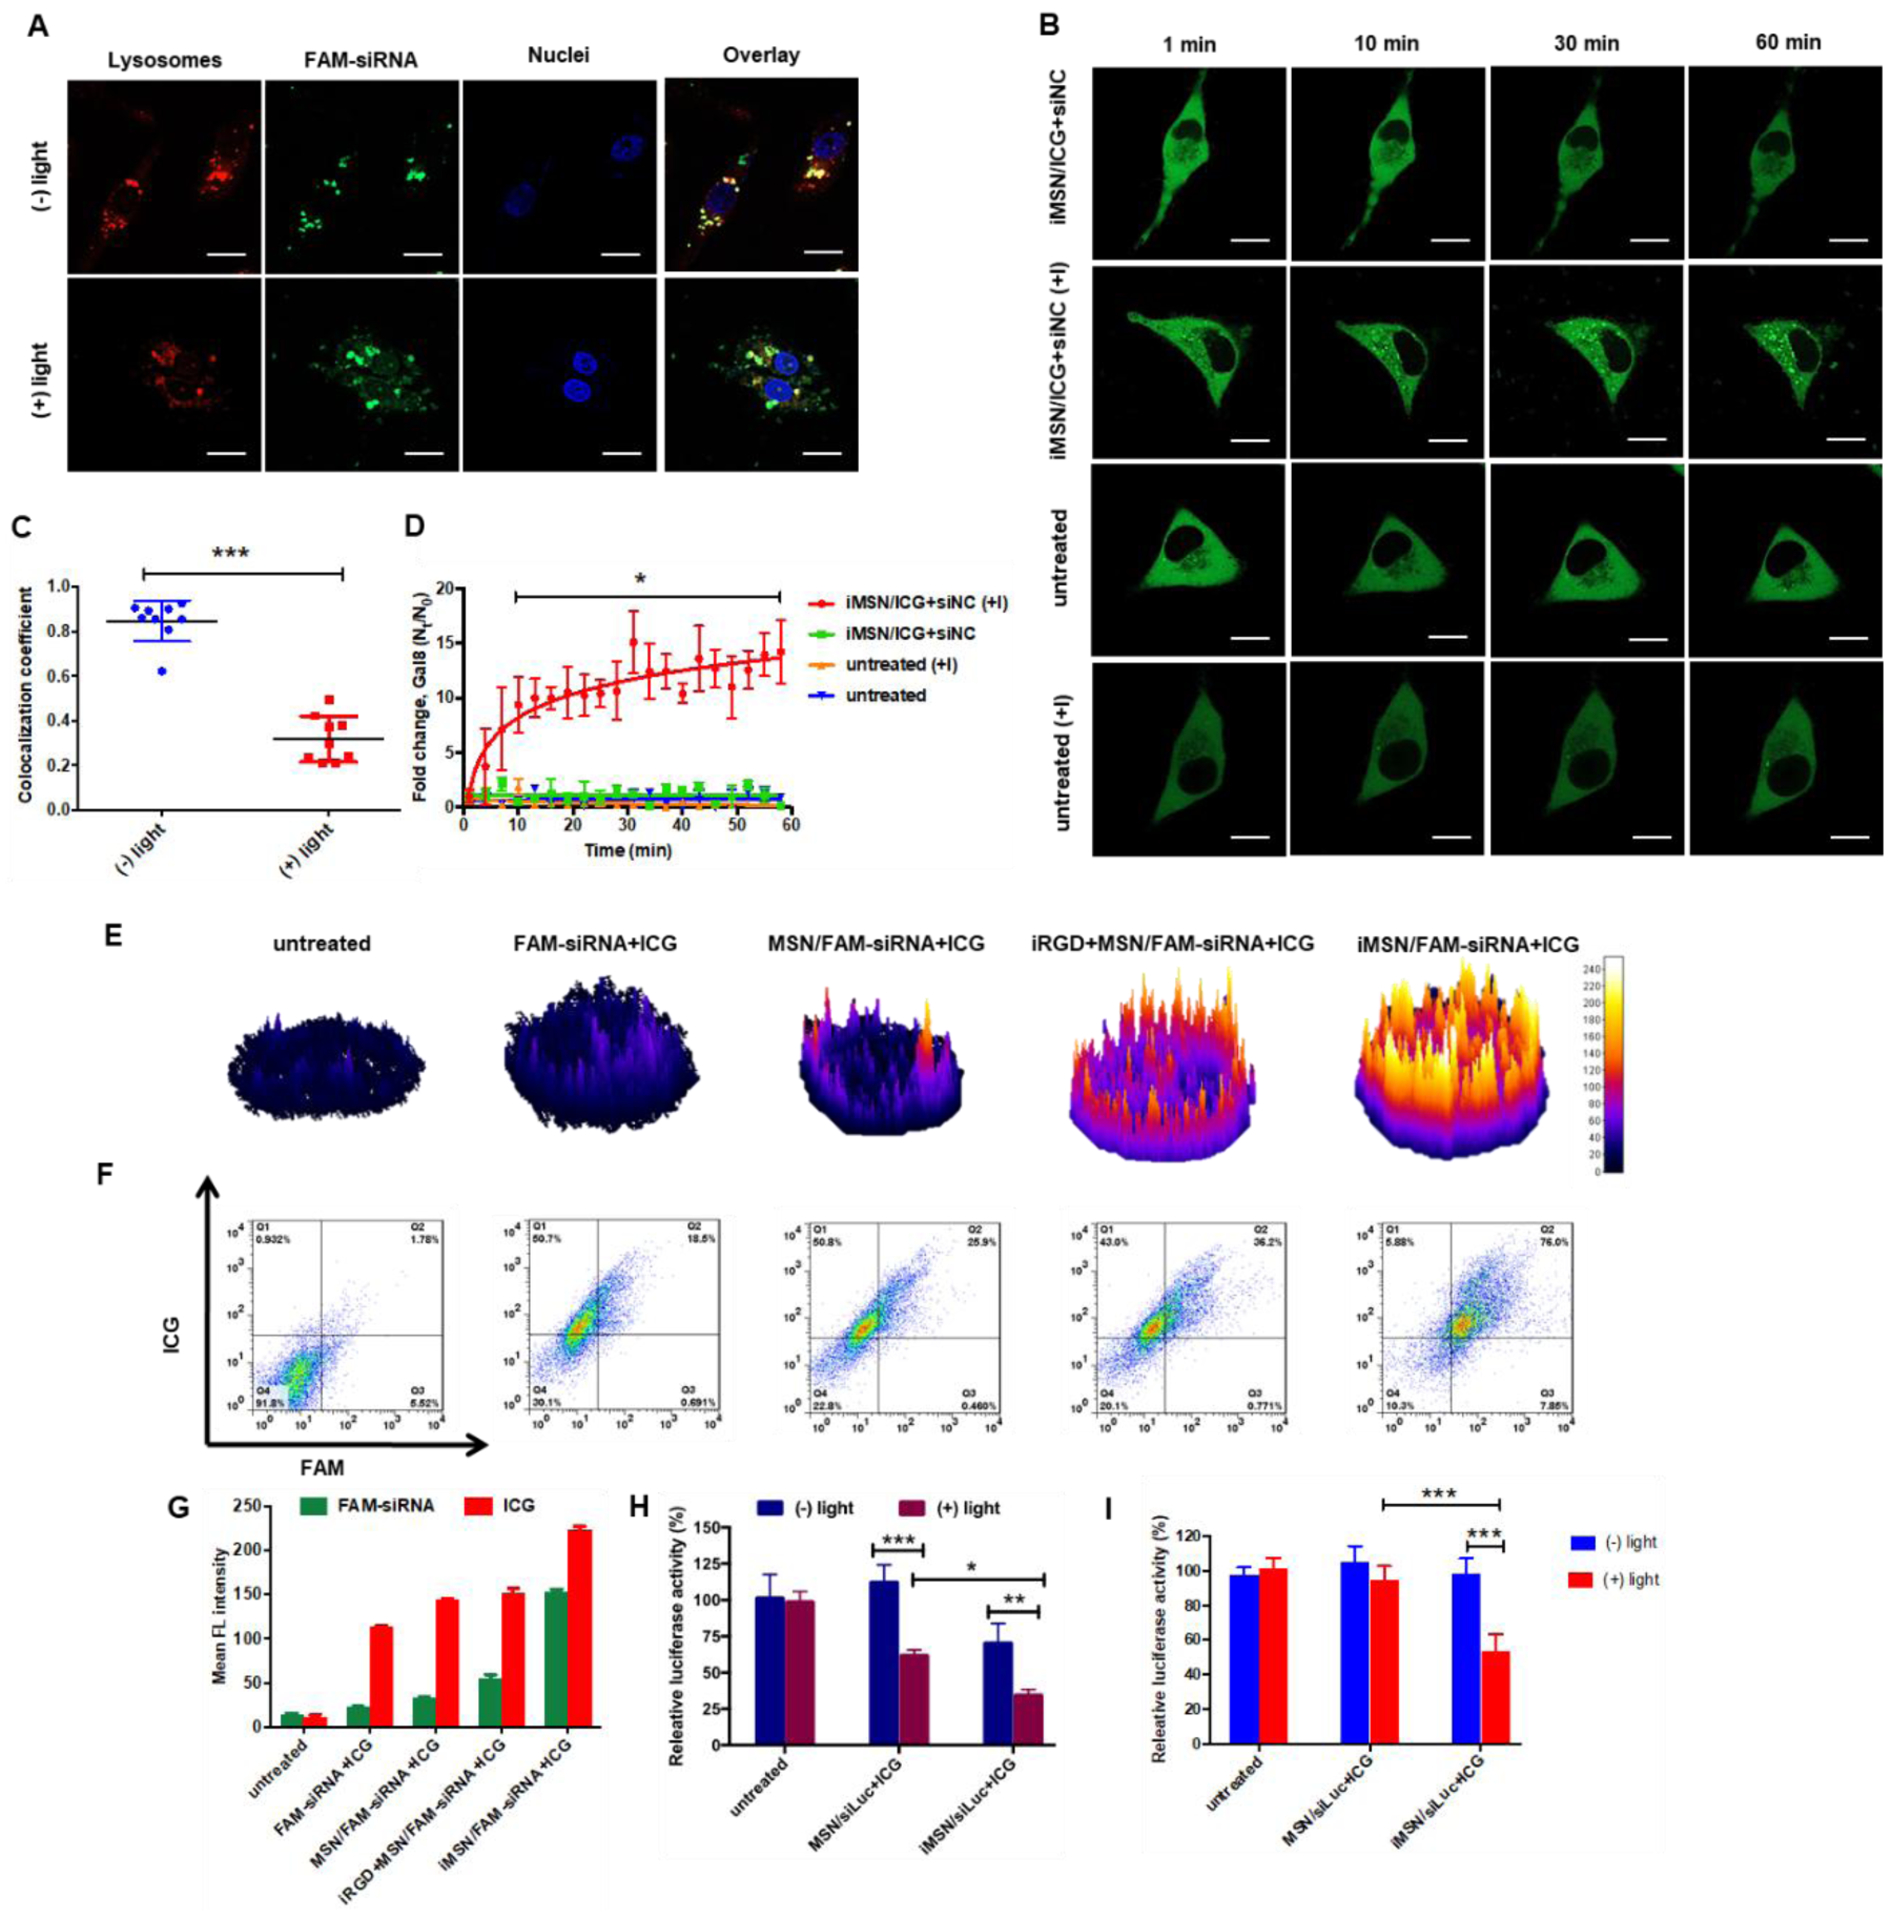
Figure 2.

(A) and (C) Intracellular trafficking of iMSN/FAM-siRNA+ICG in MDA-MB-231 cells with (+) or without (-) light irradiation using Lysotracker and Manders’ colocalization coefficient analysis. The value of 0 indicates no colocalization of FAM-siRNA and Lysotracker, value of 1 indicates complete colocalization. (scale bar=20 μm) (B) and (D) Confocal images of untreated MDA-MB-231-Gal8 cells and iMSN/siNC+ICG treated cell (+) or (-) light irradiation at different time points. Endosomal disruption kinetics plotted as fold change in Gal8 punctation. Scale bar=10 μm. (E) Fluorescence (ICG) surface plot images of MDA-MB-231 tumor spheroids treated with free FAM-siRNA+ICG, MSN/FAM-siRNA+ICG, iRGD+MSN/FAM-siRNA+ICG, iMSN/FAM-siRNA+ICG and negative control. (F) and (G) Flow cytometry analysis of single cell suspension from spheroids after different treatments, as indicated with double-positive staining cells and mean fluorescence intensity. (H) Luc silencing efficacy of siLuc loaded in MSN or iMSN (+) or (-) light irradiation in cells. Data expressed as mean ± SD (n = 3). **p<0.01, ***p<0.001. (I) Luciferase silencing efficacy with siLuc loaded in MSNs or iMSNs (+) or (-) light irradiation in MDA-MB-231.Luc spheroids. Data expressed as mean ± SD (n = 3). ***p<0.001.
