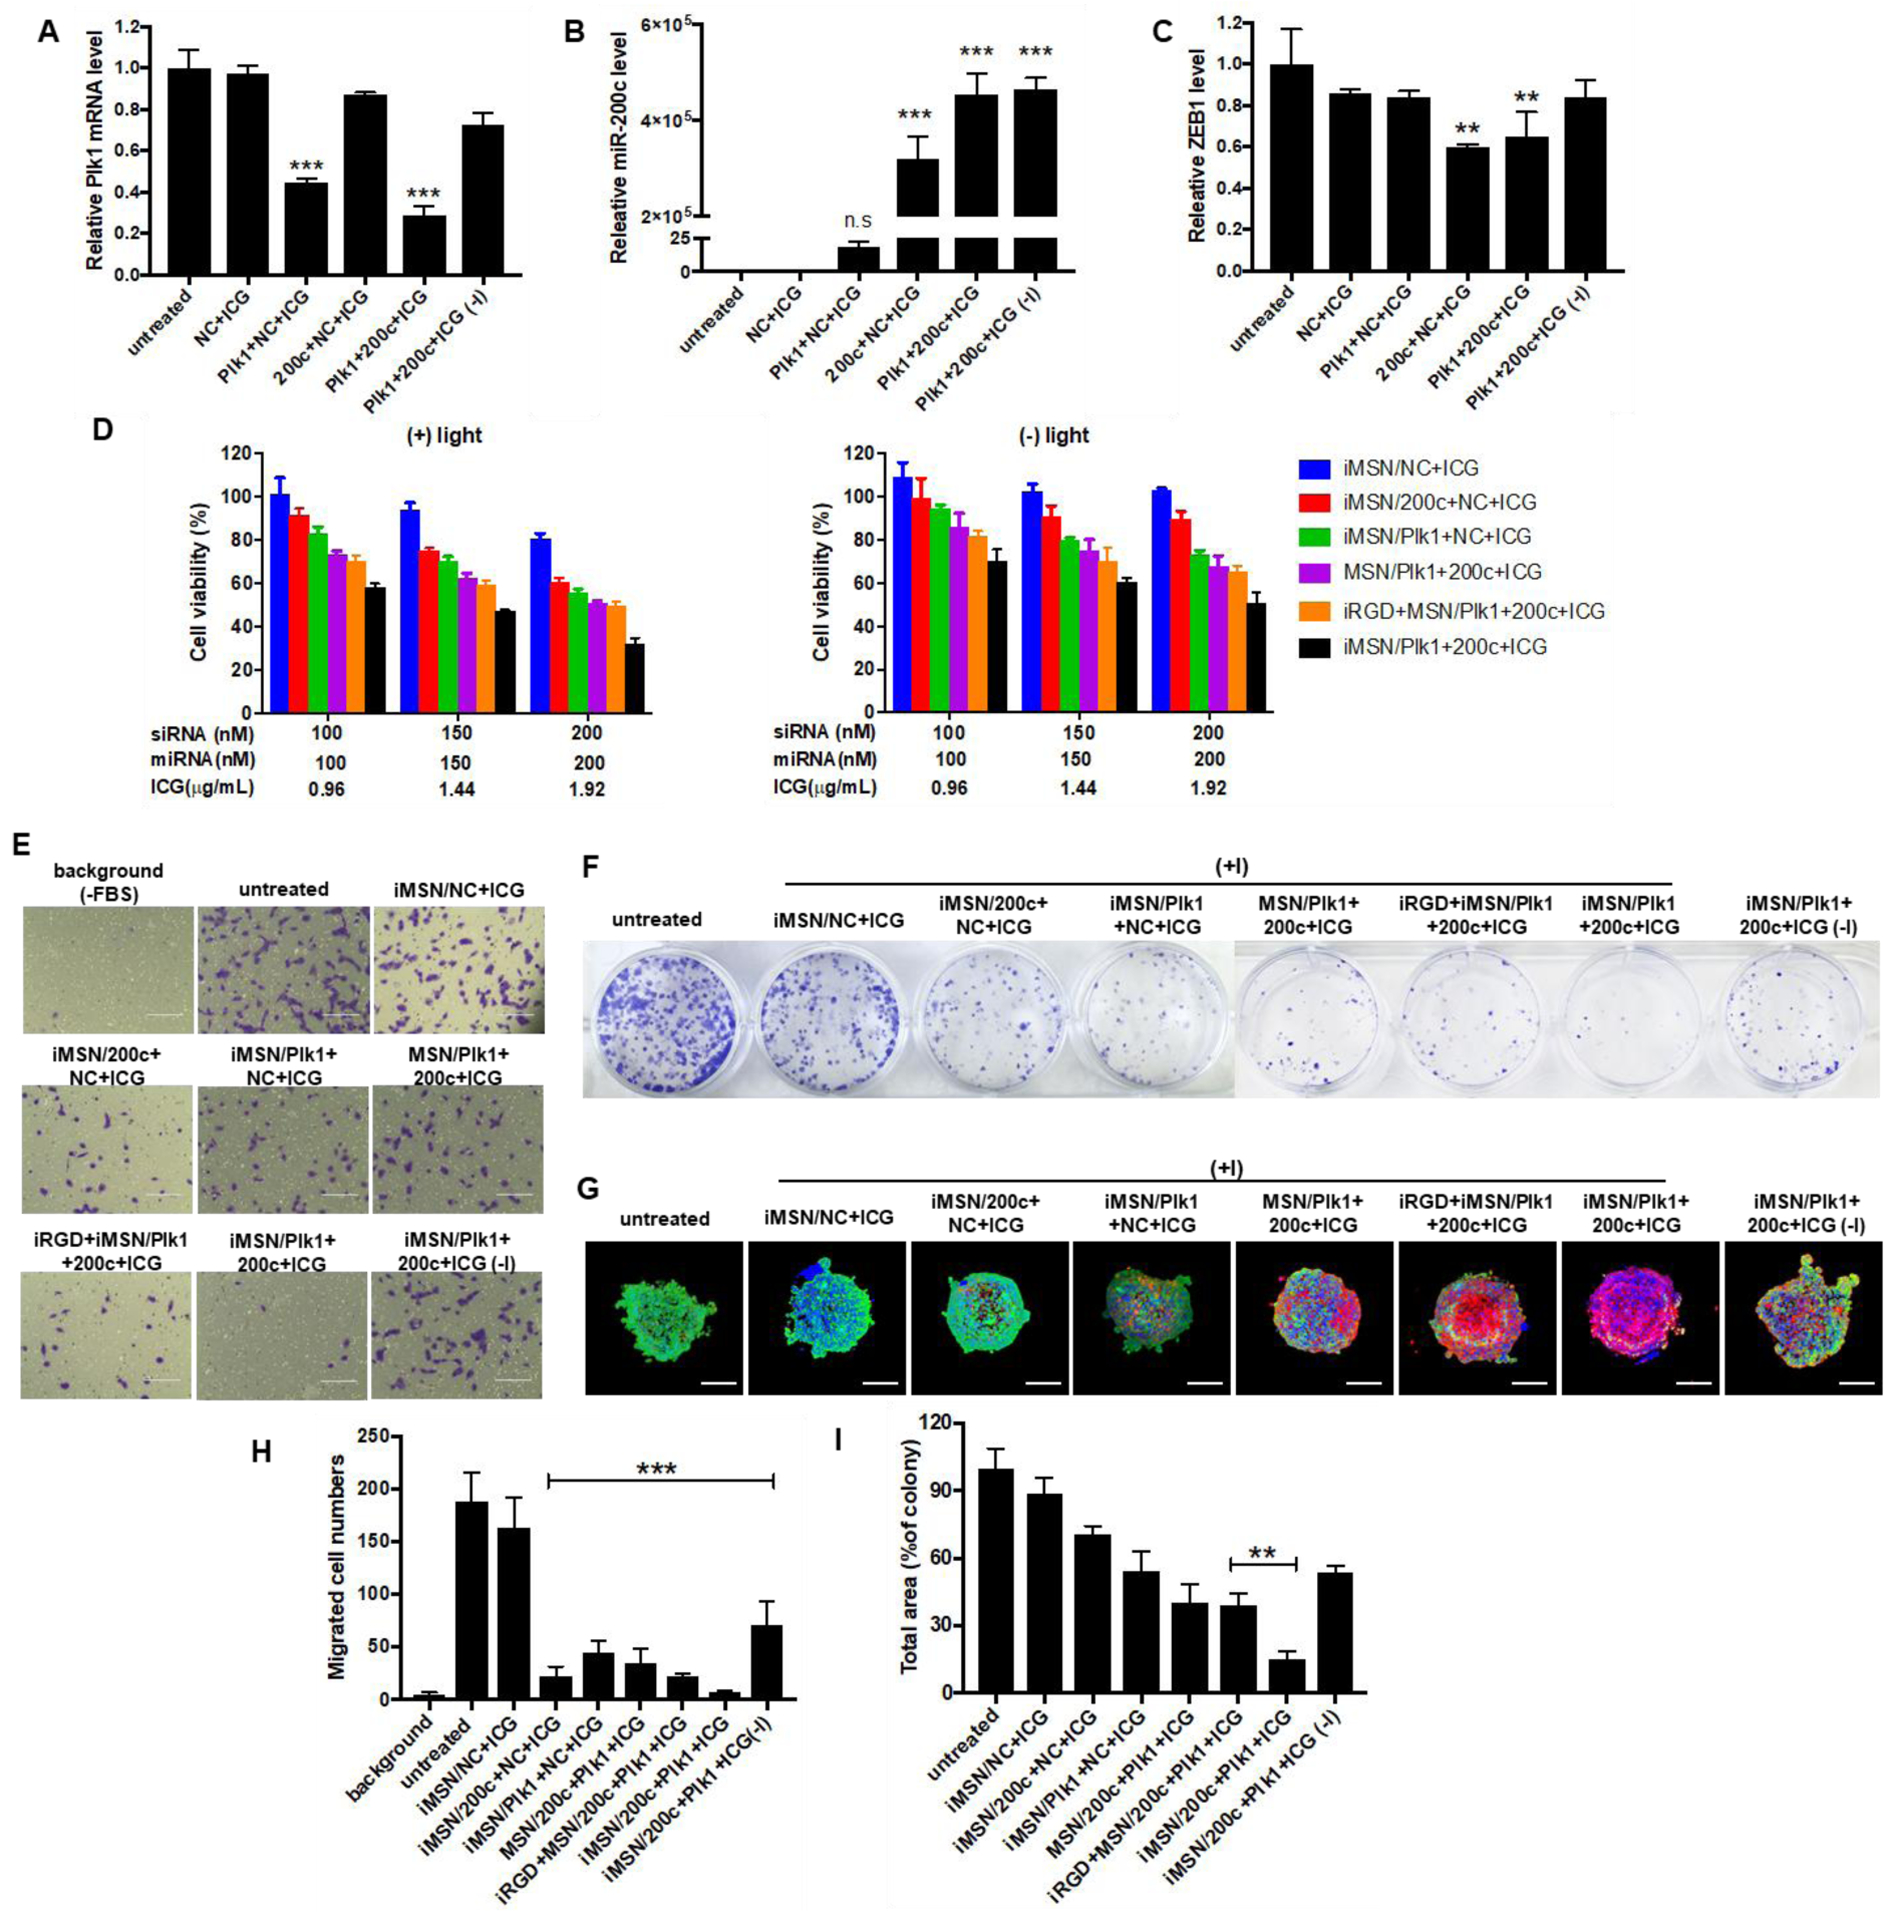
Figure 3.

(A) qRT-PCR analysis of Plk1 mRNA level in MDA-MB-231 cells following treatment with iMSN/NC+ICG, iMSN/200c+NC+ICG, iMSN/Plk1+NC+ICG, iMSN/Plk1+200c+ICG plus light irradiation and iMSN/Plk1+200c+ICG (-) light. ***p<0.001 vs untreated. (B) and (C) Relative miR-200c and ZEB1 mRNA levels in cells transfected with different groups were detected by qRT-PCR. ***p<0.001 vs untreated, **p<0.01 vs untreated. (D) Cell viability of cells after different treatments for 48 h (+) or (-) light irradiation. iRGD+MSN/Plk1+200c+ICG represents the co-administration formulation of iRGD peptide and nanoparticle. Data expressed as mean ± SD (n = 3). (E) Inhibition of FBS-induced cancer cell migration following various treatments. “Background” represents randomly migrating cells without FBS and “untreated” represents migrating cells with FBS. (F) Representative images of colonies treated by different nanoparticles from the clonogenic assay at 14 days. (G) Representative images of live/dead viability assays in MDA-MB-231 spheroids following treatments (+) or (-) light irradiation. The dead cells were stained red by EthD-1 and live cells were stained green with calcein AM. Nuclei were stained with Hoechst (blue). Scale bar=200 μm. (H) The number of migrated cells was counted under microscope and results are expressed as average number of migrated cells/20× view ± SD (n =9). “Background” represented migrated cells in FBS-free media without any treatment. ***p<0.001 vs untreated. (I) Quantification of colonies from the clonogenic assay at 14 days. Data expressed as mean ± SD (n = 3). **p<0.01 vs iRGD+MSN/200c+Plk1+ICG.
