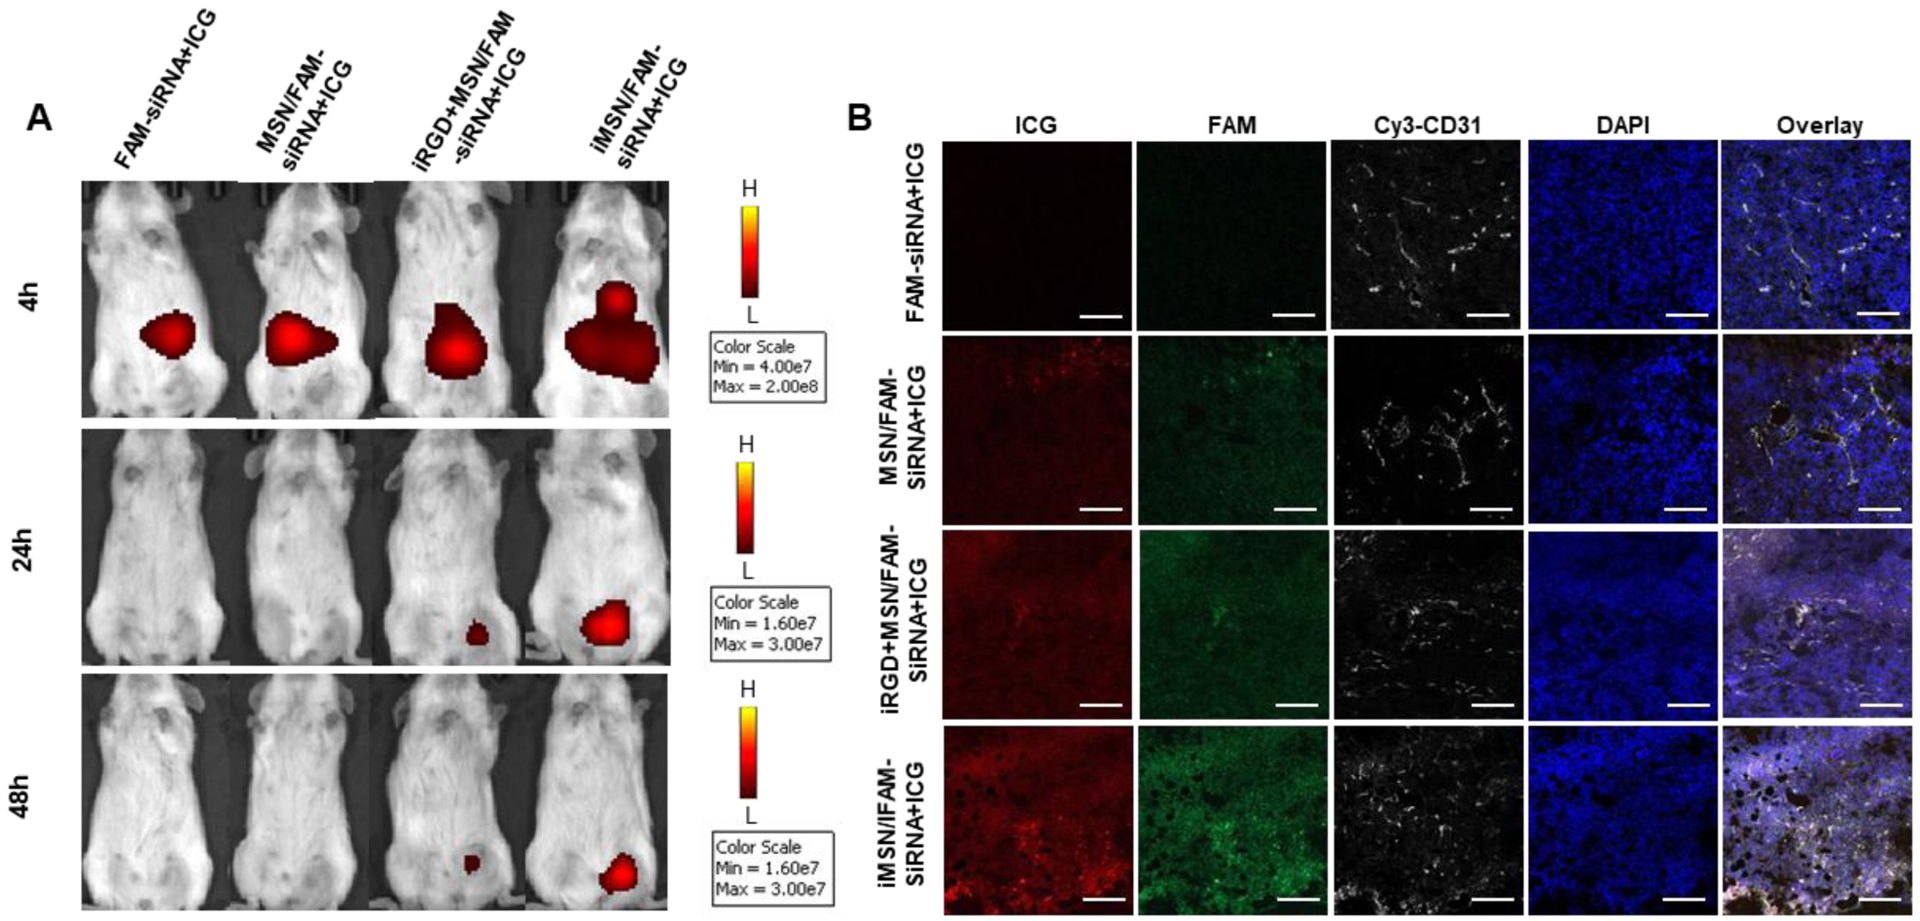
Figure 4.

(A) IVIS imaging of mice at 4, 24, and 48 h after i.v. administration of free drug and nanoparticles. Fluorescence signal was from ICG. (B) Confocal microscopic images of tumor cryosections. Tumor vasculature was stained with Cy3-CD31 antibody (white). ICG was shown in red, FAM-siRNA was in green and the nuclei in blue (DAPI). Scale bar=100 μm.
