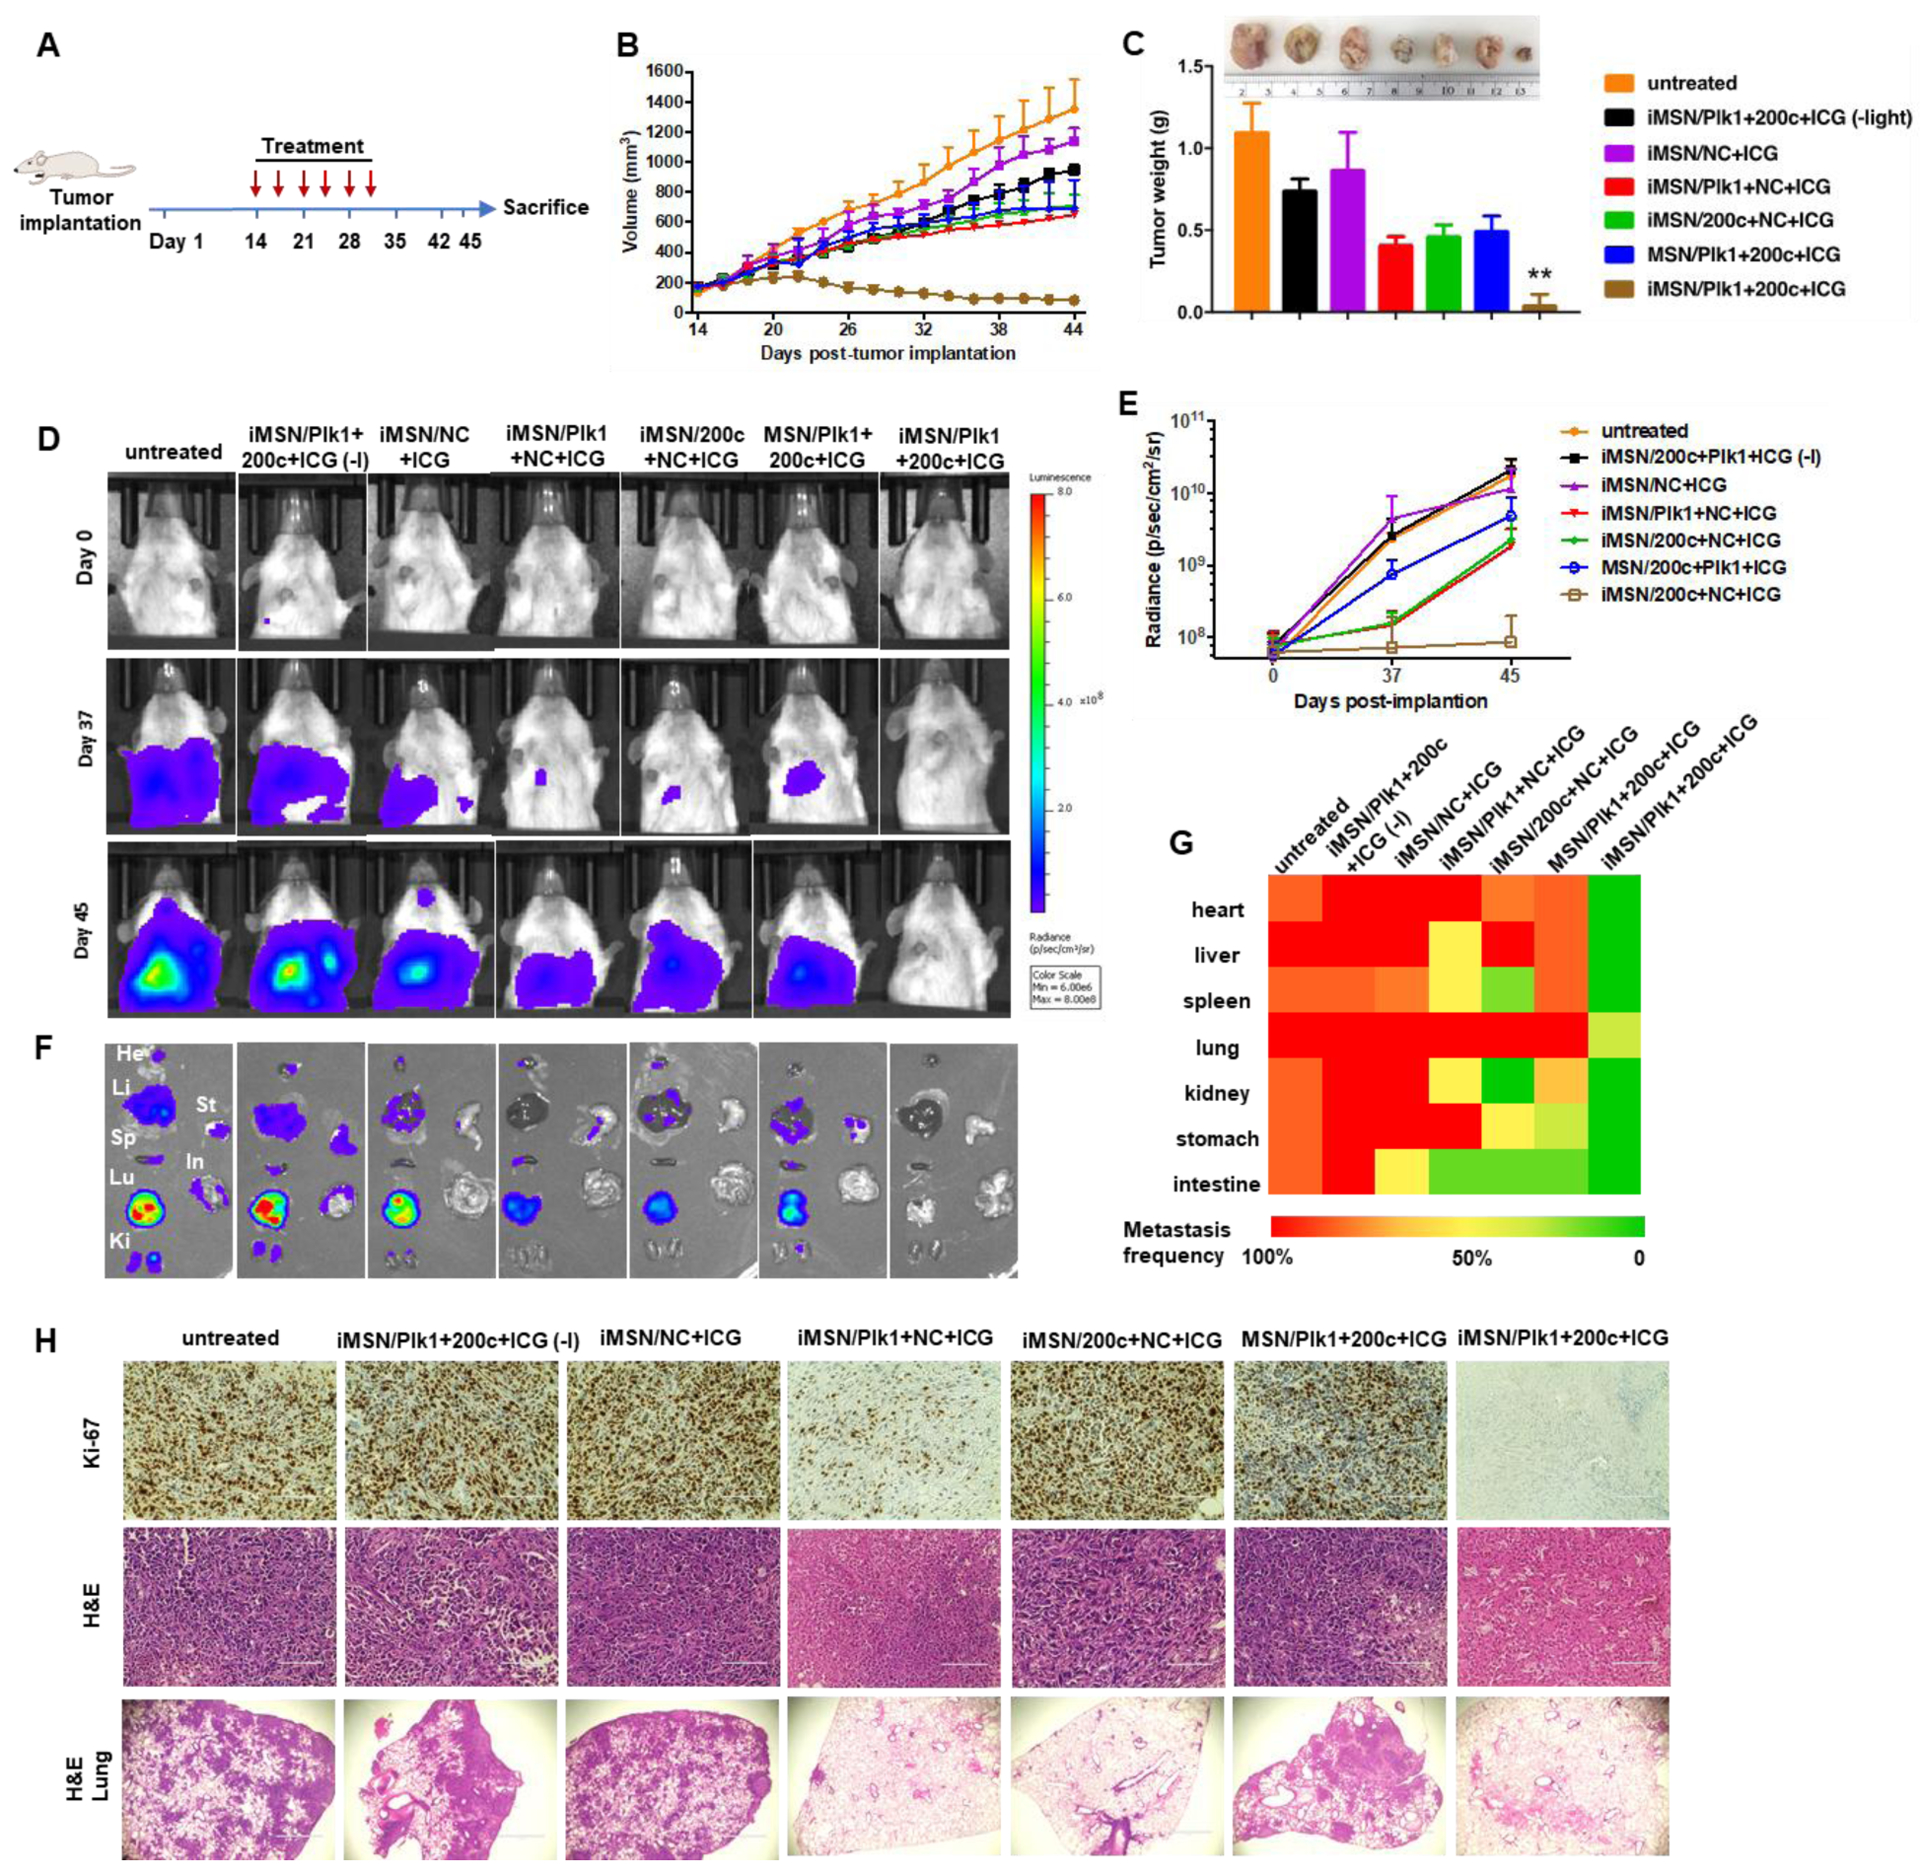
Figure 5.

(A) Treatment schedule to assess efficacy of the siPlk1+miR-200c combination treatment in the orthotopic MDA-MB-231 breast cancer model. (B) Tumor growth curves in mice treated with saline, iMSN/NC+ICG, iMSN/Plk1+200c+ICG (-light), iMSN/Plk1+NC+ICG, iMSN/200c+NC+ICG, MSN/Plk1+200c+ICG and iMSN/Plk1+200c+ICG (+) or (-) light irradiation. (C) Representative images and weight of the isolated tumors from different groups. **p<0.01 vs all the groups. (D) Representative bioluminescence images of mice at day 0, 37, and 45 post-tumor implantation. (E) Quantitative analysis of bioluminescence signal in tumor-bearing mice during treatments. (F) Ex vivo images of bioluminescence signal in isolated organs. (G) Heat map showing the summary of the comparative analysis of tumor spread measured by quantitative ex vivo imaging in (F). (H) Ki-67 and H&E staining images of tumor sections. Scale bar=100 μm. Representative images of lung tissue sections stained with H&E. Scale bar=1000 μm. Results are shown as mean ± SD (n = 5).
