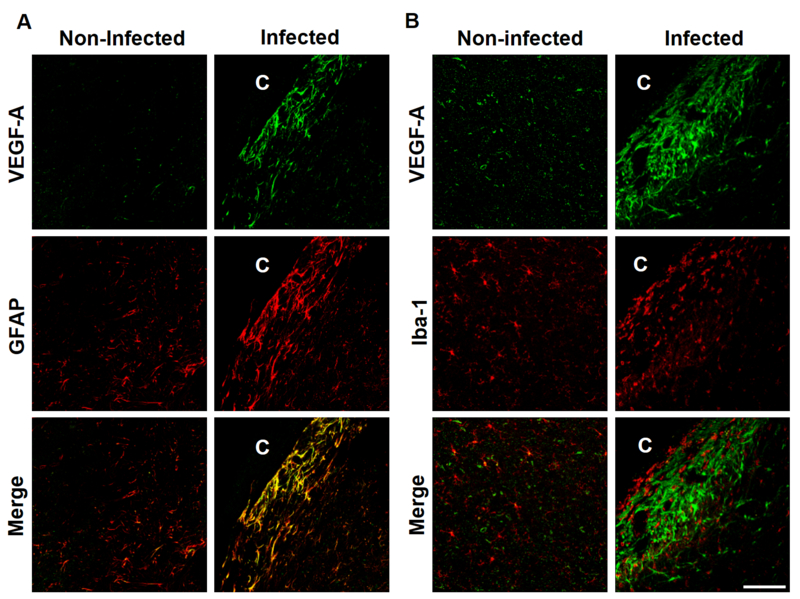
Fig. 3.

VEGF-A and glial cells double staining. C shows cysticercus location. Panel A, GFAP and VEGF-A double labeling. Control regions show colocalization between VEGF-A and GFAP and some Iba-1 positive cells colocalize with VEGF-A. Infected regions show most VEGF-A overexpression colocalizing with GFAP. Panel B, Iba-1 and VEGF-A double labeling. In control regions some microglial cells colocalized with VEGF-A (yellow). Non-colocalization is observed between Iba-1 and VEGF-A in infected brains. Scale bar 100μm
