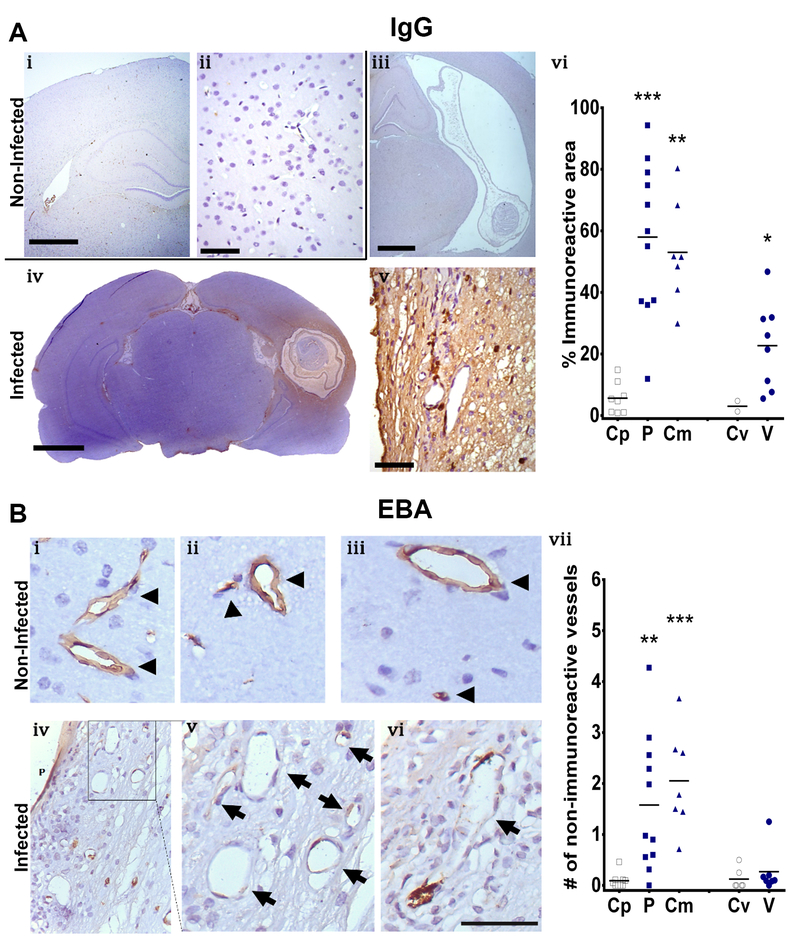
Fig. 4.
IgG and EBA staining for BBB disruption evaluation. Panel A, IgG IHC staining. i and ii represent control brains, reflecting no staining at low (i) and high magnification (ii). iii, iv and v represent infected brains, reflecting ventricular cysts with scarce staining (iii), parenchymal cysts with diffuse staining surrounding the cysts (iv) and a high magnification image showing some stained cells (v). vi represents a comparison of the immunoreactive area for IgG staining by cyst location, Control region (Cp, [n=8]), parenchymal cyst (P, [n=11]), corticomeningeal cyst (Cm, [n=7]), control region of the ventricle (Cv, [n=2]), ventricular cyst (V, n=[8]). i, iii, iv (scale bar 1mm); ii, v, (scale bar 50μm). Panel B, EBA staining. i, ii and iii represent control brains with normal immunoreactive vessels (arrowhead). iv, v and vi represent infected brains. vii represents the comparison of the number of non-immunoreactive vessels per field by cyst location. Control region (Cp, [n=9]), parenchymal cyst (P, [n=11]), corticomeningeal cyst (Cm, [n=7]), control region of the ventricle (Cv, [n=6]), ventricular cyst (V, [n=7]). Mann-Whitney U, P<0.05 (*), P<0.001 (**), P<0.0001 (***)

