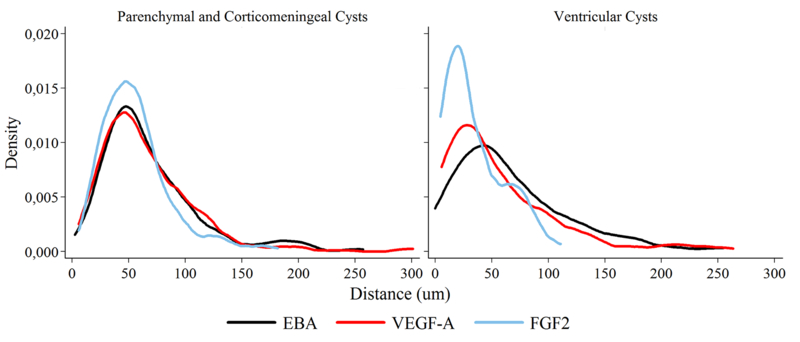
Fig. 6.

Gradient distribution of angiogenic and BBB disruption markers surrounding T. solium cysticerci. Distance represents the extension, starting from the border of the tissue in contact with the cyst. In parenchymal and corticomeningeal cysts all markers are similarly codistributed, while in ventricular cysts markers differ in distribution and extension. In both cases, VEGF-A and EBA extend up to approximately 300μm (gliotic area)
