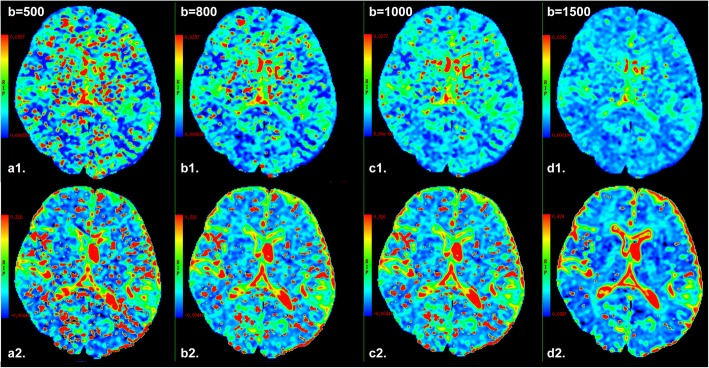
Fig. 3.
Brain pseudodiffusion parametric maps from one representative subject. The top row depicts D* maps (a1-d1) calculated by 4 sets of multiple b-value DWI with different high b-value upper limit (500, 800, 1000, 1500 s/mm2, respectively) and the same low b-value distribution (0, 30, 60, 90, 120, 150, 180, 200 s/mm2), meanwhile the bottom row shows corresponding f maps (a2-d2) derived from IVIM DWI model in normal brain. As the increase of high b-value upper limit, the red color area representing fast diffusion effect in brain tissue was reduced on pseudodiffusion images, reflecting increased fast diffusion effect. At the same time, much red color area was displayed at 500 s/mm2 high b-value upper limit (a1 or a2), and relative absent red area on pseudodiffusion images when high b-value upper limit reached 1500 s/mm2 (d1 or d2)

