Fig. 5.

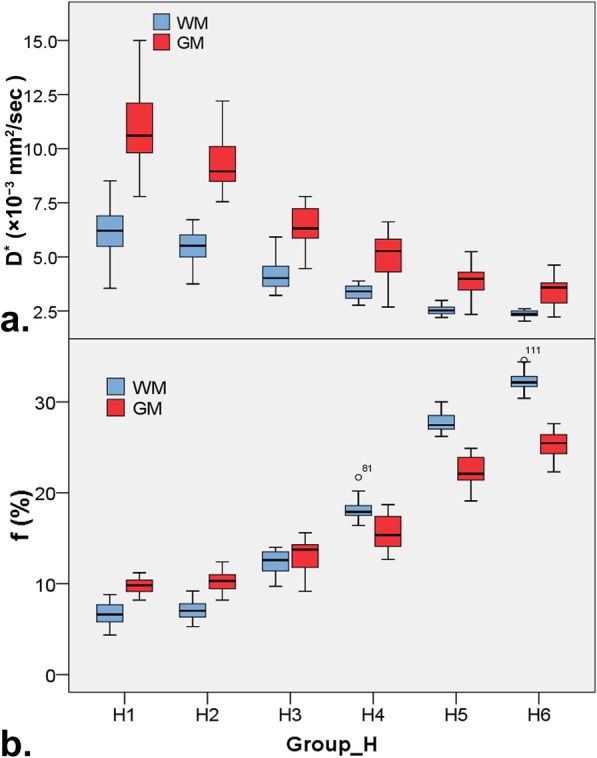
Box plots for pseudodiffusion parameter of D* (a) and f (b) derived from IVIM DWI among groups with different high b-value upper limit in brain white matter (WM) and gray matter (GM)

Box plots for pseudodiffusion parameter of D* (a) and f (b) derived from IVIM DWI among groups with different high b-value upper limit in brain white matter (WM) and gray matter (GM)