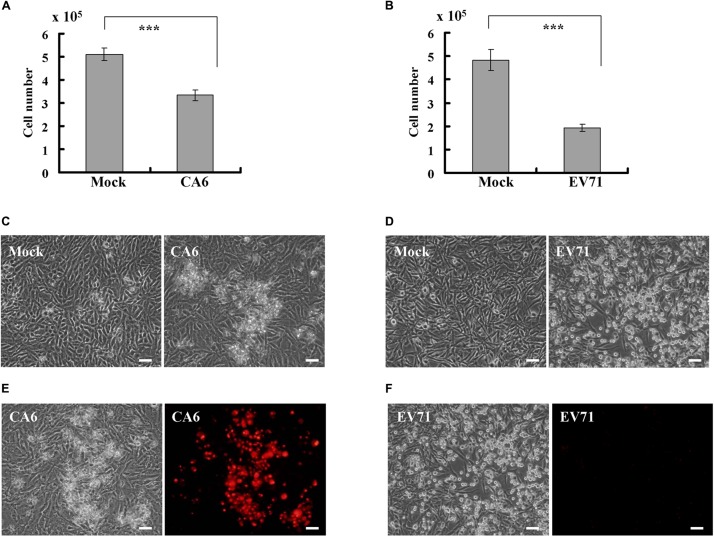
FIGURE 1.
CA6 induces cytopathic effects in RD cells. (A) Cell number analysis after CA6 infection (MOI = 5) at 36 h. The cell numbers were counted by trypan blue staining. The results represent the mean ± SD of three independent experiments. ***P < 0.001. (B) Cell number analysis after EV71 infection (MOI = 1) at 24 h. The cell numbers were counted by trypan blue staining. The results represent the mean ± SD of three independent experiments. ***P < 0.001. (C) Cell morphologic analysis after mock or CA6 (MOI = 5) infection was performed at 36 h post infection. Results are representative of three independent experiments. Bar = 20 μm. (D) Cell morphologic analysis after mock or EV71 (MOI = 1) infection was performed at 24 h post infection. Results are representative of three independent experiments. Bar = 20 μm. (E) Cell morphologic analysis with propidium iodide staining after CA6 (MOI = 5) infection was performed at 36 h post infection by light microscopy (left) or fluorescence microscopy (right). Results are representative of three independent experiments. Bar = 20 μm. (F) Cell morphologic analysis with propidium iodide staining after EV71 (MOI = 1) infection was performed at 24 h post infection and assessed by light microscopy (left) or fluorescence microscopy (right). Results are representative of three independent experiments. Bar = 20 μm.

