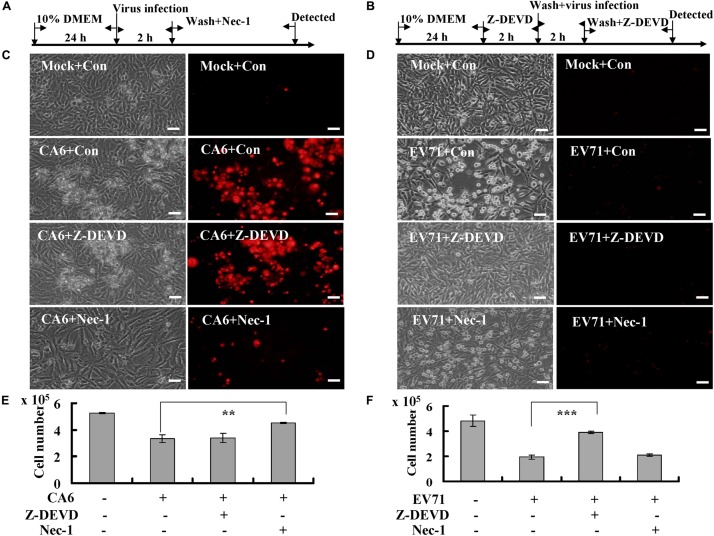
FIGURE 2.
Necrostatin-1 inhibits cell death induced by CA6 infection. (A) Flow diagram of RD cells treated with necroptosis inhibitor (necrostatin-1). RD cells were mock-infected or infected with CA6 (MOI = 5) or EV71 (MOI = 1). After 2 h, the cells were washed again with PBS and treated with 150 μM of necrostatin-1 (Nec-1) or 0.05% DMSO in 10% DMEM (Con) for the indicated times. (B) Flow diagram of RD cells treated with caspase-3 inhibitor (Z-DEVD-FMK). RD cells were pre-treated with 20 μM of Z-DEVD-FMK inhibitor (Z-DEVD) or 0.05% DMSO in 10% DMEM (Con) for 2 h. The cells were then washed with PBS and mock-infected or infected with CA6 (MOI = 5) or EV71 (MOI = 1). After 2 h, the cells were washed again with PBS and re-treated with 20 μM of Z-DEVD-FMK or 0.05% DMSO in 10% DMEM for the indicated times. (C) Cell morphologic analysis with propidium iodide staining after CA6 (MOI = 5) infection was performed at 36 h post infection with necrostatin-1 or Z-DEVD-FMK treatment by light microscopy (left) or fluorescence microscopy (right). Results are representative of three independent experiments. Bar = 20 μm. (D) Cell morphologic analysis with propidium iodide staining after EV71 (MOI = 1) infection was performed at 24 h post infection with necrostatin-1 or Z-DEVD-FMK treatment by light microscopy (left) or fluorescence microscopy (right). Results are representative of three independent experiments. Bar = 20 μm. (E) Cell number analysis after CA6 infection (MOI = 5) at 36 h treatment with control, necrostatin-1, or Z-DEVD-FMK. The cell numbers were counted by trypan blue staining. The results represent the mean ± SD of three independent experiments. **P < 0.01. (F) Cell number analysis after EV71 infection (MOI = 1) at 24 h treatment with control, necrostatin-1, or Z-DEVD-FMK. The cell numbers were counted by trypan blue staining. The results represent the mean ± SD of three independent experiments. ***P < 0.001. Nec-1, necrostatin-1; Z-DEVD, Z-DEVD-FMK; Mock, Mock infection; Con, control.

