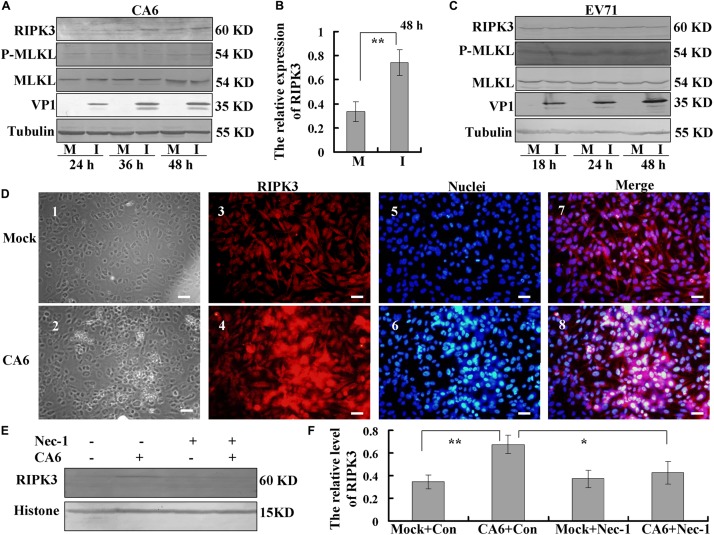
FIGURE 3.
Analysis of host necroptosis regulatory proteins. (A) RD cells were mock-infected (M) or infected with CA6 at a MOI of 5 (I) and then collected at the indicated times. RIPK3, p-MLKL, MLKL, and VP1 were detected by Western blot analysis. Tubulin is shown as a loading control. Results are representative of three independent experiments. (B) RD cells were mock-infected (M) or infected with CA6 at a MOI of 5 (I) and then collected at the 48 h post infection. The band of RIPK 3 and corresponding tubulin was processed by ImageJ, and the ratio of intensity of RIPK3 to corresponding tubulin was shown. The results represent the mean ± SD of three independent experiments. **P < 0.01. (C) RD cells were mock-infected (M) or infected with EV71 at a MOI of 1 (I) and then collected at the indicated times. RIPK3, p-MLKL, MLKL, and VP1 were detected by Western blot analysis. Tubulin is shown as a loading control. Results are representative of three independent experiments. (D) RIPK3 distribution as assessed by fluorescence microscopy at 36 h post-infection with CA6 at a MOI of 5. Cells were stained with RIPK3 antibody, and then co-stained with CoraLite594-conjugated-second antibody (Red). DNA was counterstained with Hoechst 33258 (Blue). Cell morphology was visualized by light microscope. Merged images of RIPK3 with DNA are shown. Results are representative of three independent experiments. Scale bar = 20 μm. (E) Necrostatin-1 inhibited the expression of RIPK3-induced by CA6. Histone is shown as a loading control. Results are representative of three independent experiments. (F) The band of panel (E) was processed by ImageJ, and the ratio of intensity of RIPK3 to corresponding histone was shown. The results represent the mean ± SD of three independent experiments. **P < 0.01. *P < 0.05.

