FIGURE 5.
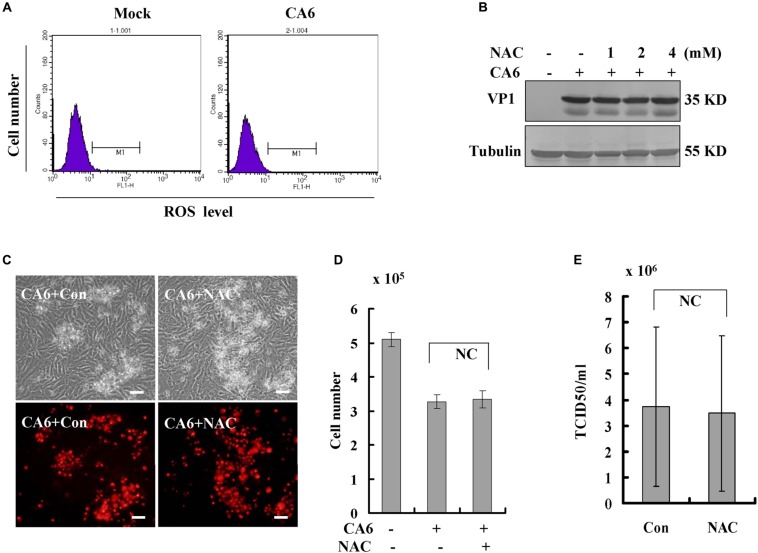
Scavengers of ROS (NAC) do not inhibit necroptosis or viral production. (A) The level of ROS was determined after CA6 infection (MOI = 5) at 36 h post-infection by flow cytometery. The results are representative of three independent experiments. (B) VP1 expression in cellular lysates was determined after growth in control medium or different doses of NAC medium at 36 h post-infection. The results are representative of three independent experiments. Tubulin is shown as loading control. The results are representative of three independent experiments. (C) Cell morphologic analysis with propidium iodide staining after CA6 (MOI = 5) infection was performed at 36 h post infection with control or NAC treatment (2 mM) by light microscopy (upper) or fluorescence microscopy (lower). Results are representative of three independent experiments. Bar = 20 μm. (D) Cell number analysis after CA6 infection at 36 h. The cell numbers were counted by trypan blue staining. The results represent the mean ± SD of three independent experiments. NC, no significant difference. (E) Total progeny viruses collected at 36 h post-infection of CA6 were titrated using RD cells. The results indicate the mean ± SD of three independent experiments. NC, no significant difference.

