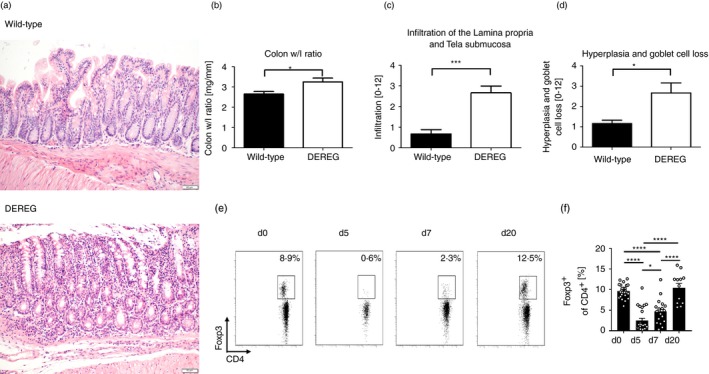
Figure 2.

Histopathology of regulatory T (Treg) cell depleted DEREG mice and wild‐type littermates. (a) Representative tissue sections of the colon from Treg‐cell‐depleted DEREG mice and wild‐type littermates at day 20 were stained with haematoxylin & eosin (H&E) to assess pathology. Images show magnification at ×200. (b) Colon from Treg‐cell‐depleted mice and wild‐type littermates was prepared and colon weight/length ratio was measured. Bars represent the mean ± SEM. (c) Immune cells that infiltrate the lamina propria and tela submucosa were quantified and scored from H&E‐stained colonic tissue in DEREG mice and wild‐type littermates. Bars represent the mean ± SEM. (d) Goblet cells in periodic acid Schiff‐stained sections were counted and referred to villus length. Bars represent the mean ± SEM. Statistical significance was calculated using unpaired t‐test. (e) Representative flow cytometry plot shows percentage of Foxp3+ from CD4+ T cells measured in the blood taken from retrobulbar plexus at day 0 before DT administration and 5, 7 and 20 days after first DT administration. (f) Bars illustrate the mean percentage of Foxp3+ from CD4+ T cells ± standard deviation. Circles indicate percentage of Foxp3+ from CD4+ T cells of individual measures. Unpaired t‐test was used to test for statistical significance, *P < 0·05, ***P < 0·001, ****P < 0·0001.
