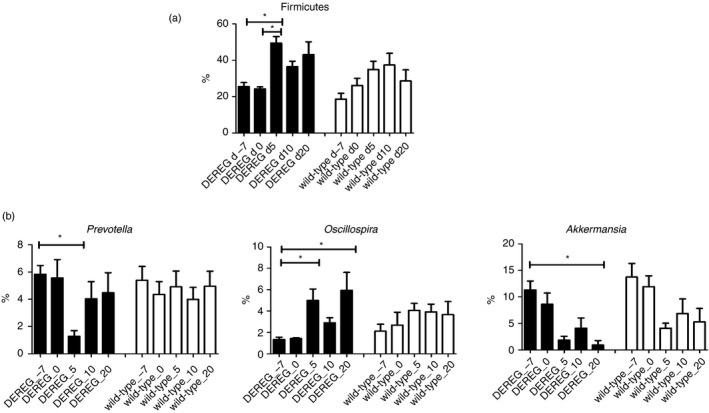
Figure 4.

Relative frequency of different abundant phyla and genera. (a) Phyla and (b) genera with a relative frequency ≥1% that were differentially abundant between time‐points before and after Treg cell depletion in DEREG mice as identified by ANCOM. DEREG mice are illustrated by black bars and wild‐type mice by white bars. Kruskal–Wallis test with Dunn's multiple comparisons was used to calculate significance between different groups. Whiskers illustrate SEM.
