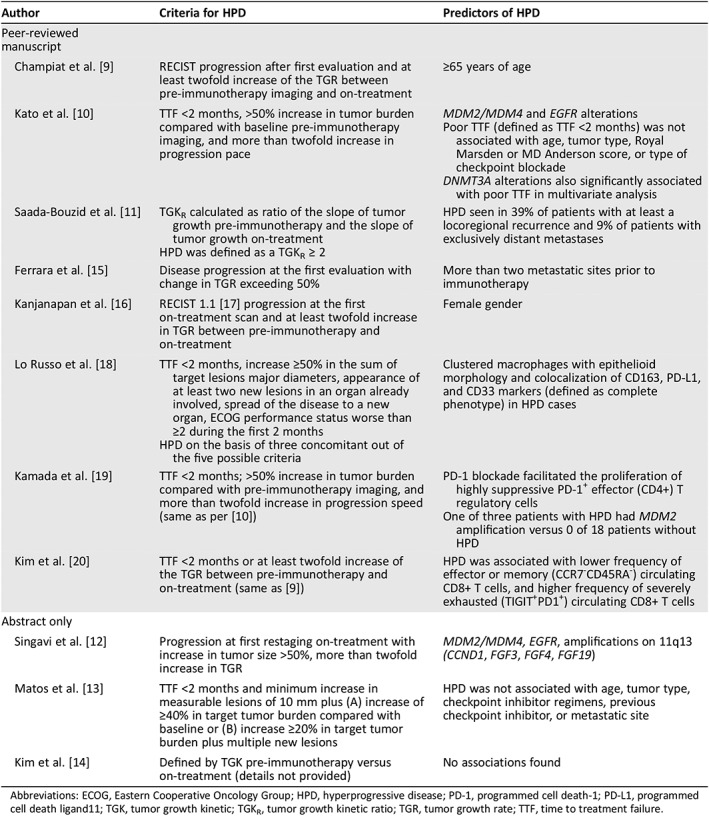
Table 1.
Criteria for and predictors of HPD according to different research groups
| Author | Criteria for HPD | Predictors of HPD |
|---|---|---|
| Peer‐reviewed manuscript | ||
| Champiat et al. 9 | RECIST progression after first evaluation and at least twofold increase of the TGR between pre‐immunotherapy imaging and on‐treatment | ≥65 years of age |
| Kato et al. 10 | TTF <2 months, >50% increase in tumor burden compared with baseline pre‐immunotherapy imaging, and more than twofold increase in progression pace |
MDM2/MDM4 and EGFR alterations Poor TTF (defined as TTF <2 months) was not associated with age, tumor type, Royal Marsden or MD Anderson score, or type of checkpoint blockade DNMT3A alterations also significantly associated with poor TTF in multivariate analysis |
| Saada‐Bouzid et al. 11 |
TGKR calculated as ratio of the slope of tumor growth pre‐immunotherapy and the slope of tumor growth on‐treatment HPD was defined as a TGKR ≥ 2 |
HPD seen in 39% of patients with at least a locoregional recurrence and 9% of patients with exclusively distant metastases |
| Ferrara et al. 15 | Disease progression at the first evaluation with change in TGR exceeding 50% | More than two metastatic sites prior to immunotherapy |
| Kanjanapan et al. 16 | RECIST 1.1 [17] progression at the first on‐treatment scan and at least twofold increase in TGR between pre‐immunotherapy and on‐treatment | Female gender |
| Lo Russo et al. 18 |
TTF <2 months, increase ≥50% in the sum of target lesions major diameters, appearance of at least two new lesions in an organ already involved, spread of the disease to a new organ, ECOG performance status worse than ≥2 during the first 2 months HPD on the basis of three concomitant out of the five possible criteria |
Clustered macrophages with epithelioid morphology and colocalization of CD163, PD‐L1, and CD33 markers (defined as complete phenotype) in HPD cases |
| Kamada et al. 19 | TTF <2 months; >50% increase in tumor burden compared with pre‐immunotherapy imaging, and more than twofold increase in progression speed (same as per 10) |
PD‐1 blockade facilitated the proliferation of highly suppressive PD‐1+ effector (CD4+) T regulatory cells One of three patients with HPD had MDM2 amplification versus 0 of 18 patients without HPD |
| Kim et al. 20 | TTF <2 months or at least twofold increase of the TGR between pre‐immunotherapy and on‐treatment (same as 9) | HPD was associated with lower frequency of effector or memory (CCR7‐CD45RA‐) circulating CD8+ T cells, and higher frequency of severely exhausted (TIGIT+PD1+) circulating CD8+ T cells |
| Abstract only | ||
| Singavi et al. 12 | Progression at first restaging on‐treatment with increase in tumor size >50%, more than twofold increase in TGR | MDM2/MDM4, EGFR, amplifications on 11q13 (CCND1, FGF3, FGF4, FGF19) |
| Matos et al. 13 | TTF <2 months and minimum increase in measurable lesions of 10 mm plus (A) increase of ≥40% in target tumor burden compared with baseline or (B) increase ≥20% in target tumor burden plus multiple new lesions | HPD was not associated with age, tumor type, checkpoint inhibitor regimens, previous checkpoint inhibitor, or metastatic site |
| Kim et al. 14 | Defined by TGK pre‐immunotherapy versus on‐treatment (details not provided) | No associations found |

Abbreviations: ECOG, Eastern Cooperative Oncology Group; HPD, hyperprogressive disease; PD‐1, programmed cell death‐1; PD‐L1, programmed cell death ligand11; TGK, tumor growth kinetic; TGKR, tumor growth kinetic ratio; TGR, tumor growth rate; TTF, time to treatment failure.
