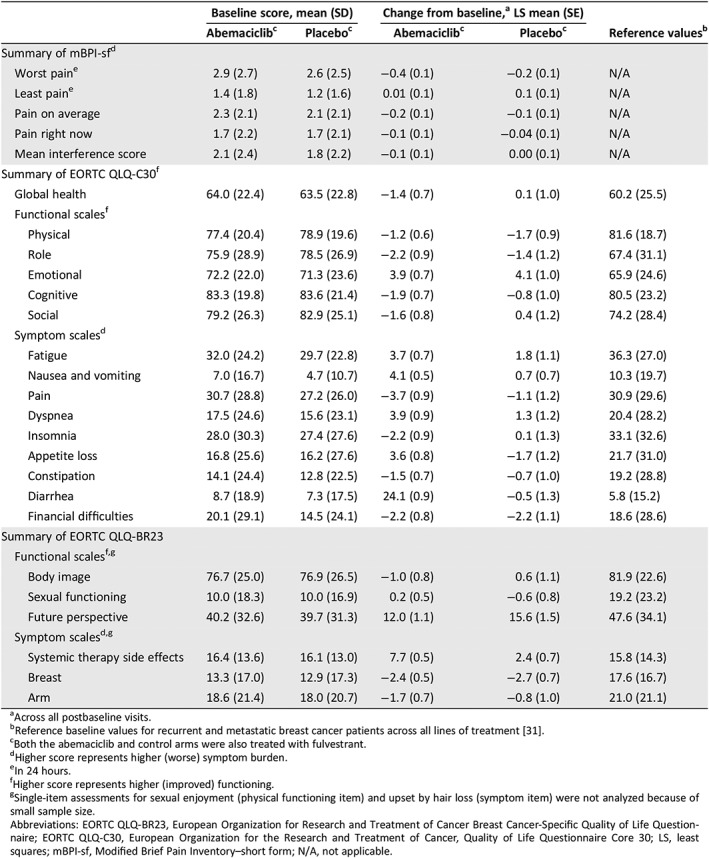
Table 1.
Baseline mean (SD) scores by study arm and within‐treatment group change from baseline: mBPI‐sf, EORTC, QLQ‐C30, EORTC QLQ‐BR23, and normative scores
| Baseline score, mean (SD) | Change from baseline,a LS mean (SE) | Reference valuesb | |||
|---|---|---|---|---|---|
| Abemaciclibc | Placeboc | Abemaciclibc | Placeboc | ||
| Summary of mBPI‐sfd | |||||
| Worst paine | 2.9 (2.7) | 2.6 (2.5) | −0.4 (0.1) | −0.2 (0.1) | N/A |
| Least paine | 1.4 (1.8) | 1.2 (1.6) | 0.01 (0.1) | 0.1 (0.1) | N/A |
| Pain on average | 2.3 (2.1) | 2.1 (2.1) | −0.2 (0.1) | −0.1 (0.1) | N/A |
| Pain right now | 1.7 (2.2) | 1.7 (2.1) | −0.1 (0.1) | −0.04 (0.1) | N/A |
| Mean interference score | 2.1 (2.4) | 1.8 (2.2) | −0.1 (0.1) | 0.00 (0.1) | N/A |
| Summary of EORTC QLQ‐C30f | |||||
| Global health | 64.0 (22.4) | 63.5 (22.8) | −1.4 (0.7) | 0.1 (1.0) | 60.2 (25.5) |
| Functional scalesf | |||||
| Physical | 77.4 (20.4) | 78.9 (19.6) | −1.2 (0.6) | −1.7 (0.9) | 81.6 (18.7) |
| Role | 75.9 (28.9) | 78.5 (26.9) | −2.2 (0.9) | −1.4 (1.2) | 67.4 (31.1) |
| Emotional | 72.2 (22.0) | 71.3 (23.6) | 3.9 (0.7) | 4.1 (1.0) | 65.9 (24.6) |
| Cognitive | 83.3 (19.8) | 83.6 (21.4) | −1.9 (0.7) | −0.8 (1.0) | 80.5 (23.2) |
| Social | 79.2 (26.3) | 82.9 (25.1) | −1.6 (0.8) | 0.4 (1.2) | 74.2 (28.4) |
| Symptom scalesd | |||||
| Fatigue | 32.0 (24.2) | 29.7 (22.8) | 3.7 (0.7) | 1.8 (1.1) | 36.3 (27.0) |
| Nausea and vomiting | 7.0 (16.7) | 4.7 (10.7) | 4.1 (0.5) | 0.7 (0.7) | 10.3 (19.7) |
| Pain | 30.7 (28.8) | 27.2 (26.0) | −3.7 (0.9) | −1.1 (1.2) | 30.9 (29.6) |
| Dyspnea | 17.5 (24.6) | 15.6 (23.1) | 3.9 (0.9) | 1.3 (1.2) | 20.4 (28.2) |
| Insomnia | 28.0 (30.3) | 27.4 (27.6) | −2.2 (0.9) | 0.1 (1.3) | 33.1 (32.6) |
| Appetite loss | 16.8 (25.6) | 16.2 (27.6) | 3.6 (0.8) | −1.7 (1.2) | 21.7 (31.0) |
| Constipation | 14.1 (24.4) | 12.8 (22.5) | −1.5 (0.7) | −0.7 (1.0) | 19.2 (28.8) |
| Diarrhea | 8.7 (18.9) | 7.3 (17.5) | 24.1 (0.9) | −0.5 (1.3) | 5.8 (15.2) |
| Financial difficulties | 20.1 (29.1) | 14.5 (24.1) | −2.2 (0.8) | −2.2 (1.1) | 18.6 (28.6) |
| Summary of EORTC QLQ‐BR23 | |||||
| Functional scalesf , g | |||||
| Body image | 76.7 (25.0) | 76.9 (26.5) | −1.0 (0.8) | 0.6 (1.1) | 81.9 (22.6) |
| Sexual functioning | 10.0 (18.3) | 10.0 (16.9) | 0.2 (0.5) | −0.6 (0.8) | 19.2 (23.2) |
| Future perspective | 40.2 (32.6) | 39.7 (31.3) | 12.0 (1.1) | 15.6 (1.5) | 47.6 (34.1) |
| Symptom scalesd , g | |||||
| Systemic therapy side effects | 16.4 (13.6) | 16.1 (13.0) | 7.7 (0.5) | 2.4 (0.7) | 15.8 (14.3) |
| Breast | 13.3 (17.0) | 12.9 (17.3) | −2.4 (0.5) | −2.7 (0.7) | 17.6 (16.7) |
| Arm | 18.6 (21.4) | 18.0 (20.7) | −1.7 (0.7) | −0.8 (1.0) | 21.0 (21.1) |

Across all postbaseline visits.
Reference baseline values for recurrent and metastatic breast cancer patients across all lines of treatment 31.
Both the abemaciclib and control arms were also treated with fulvestrant.
Higher score represents higher (worse) symptom burden.
In 24 hours.
Higher score represents higher (improved) functioning.
Single‐item assessments for sexual enjoyment (physical functioning item) and upset by hair loss (symptom item) were not analyzed because of small sample size.
Abbreviations: EORTC QLQ‐BR23, European Organization for Research and Treatment of Cancer Breast Cancer‐Specific Quality of Life Questionnaire; EORTC QLQ‐C30, European Organization for the Research and Treatment of Cancer, Quality of Life Questionnaire Core 30; LS, least squares; mBPI‐sf, Modified Brief Pain Inventory–short form; N/A, not applicable.
