
Table 1.
Characteristics of BCPPs and the comparison group
| Characteristics | Comparison group | BCPP group | p value | ||
|---|---|---|---|---|---|
| n | % | n | % | ||
| Total | 914 | 249 | |||
| Age at breast cancer diagnosis, mean (SD), years | 32.26 | (4.2) | 31.04 | (4.2) | <.01 |
| Years of follow‐up, mean (SD) | 3.81 | (2.6) | 4.28 | (2.6) | .01 |
| No. of deaths | 69 | 12 | 4.82 | ||
| Age at death, mean (SD), years | 36.47 | (5.1) | 35.93 | (4.5) | .81 |
| Years between diagnosis and pregnancy, mean (SD) | 3.31 (2.1) | ||||
| Year of breast cancer diagnosis | |||||
| 2002–2004 | 154 | 16.9 | 66 | 26.5 | .01 |
| 2005–2007 | 336 | 36.8 | 78 | 31.3 | |
| 2008–2010 | 322 | 35.2 | 84 | 33.7 | |
| 2011–2014 | 102 | 11.2 | 21 | 8.4 | |
| Stage | |||||
| I | 438 | 47.9 | 126 | 50.6 | .75 |
| II | 439 | 48.0 | 113 | 45.4 | |
| III | 37 | 4.1 | 10 | 4.0 | |
| Tumor size, cm | |||||
| ≤2 | 505 | 55.3 | 150 | 60.2 | .46 |
| 2–5 | 354 | 38.7 | 87 | 34.9 | |
| >5 | 40 | 4.4 | 10 | 4.0 | |
| No information | 15 | 1.6 | 2 | 0.8 | |
| Positive nodes | |||||
| 0 | 657 | 71.9 | 173 | 69.5 | .13 |
| 1‐3 | 146 | 16.0 | 34 | 13.7 | |
| 4‐9 | 40 | 4.4 | 15 | 6.0 | |
| ≥10 | 25 | 2.7 | 5 | 2.0 | |
| No information | 46 | 5.0 | 22 | 8.8 | |
| Histological grade | |||||
| Well differentiated | 146 | 16.0 | 40 | 16.1 | .27 |
| Moderately differentiated | 340 | 37.2 | 97 | 39.0 | |
| Poorly or undifferentiated | 325 | 35.6 | 75 | 30.1 | |
| No information | 103 | 11.3 | 37 | 14.9 | |
| Hormone receptor status | |||||
| ER status | |||||
| ER− | 143 | 31.5 | 46 | 34.6 | .50 |
| ER+ | 311 | 68.5 | 87 | 65.4 | |
| No information | 460 | 116 | |||
| PR status | |||||
| PR− | 181 | 39.9 | 50 | 37.6 | .64 |
| PR+ | 273 | 60.1 | 83 | 62.4 | |
| No information | 460 | 116 | |||
| HER2 status | |||||
| HER2− | 71 | 74.0 | 17 | 81.0 | .50 |
| HER2+ | 25 | 26.0 | 4 | 19.0 | |
| No information | 818 | 228 | |||
| Treatmenta | |||||
| Surgery | |||||
| None | 20 | 2.2 | 19 | 7.6 | <.01 |
| Breast conserving | 512 | 56.0 | 148 | 59.4 | |
| Mastectomy | 379 | 41.5 | 81 | 32.5 | |
| Radiotherapy | 394 | 43.1 | 120 | 48.2 | .43 |
| Chemotherapy | 670 | 73.3 | 148 | 59.4 | <.01 |
| Hormone therapy | 535 | 58.5 | 111 | 44.6 | <.01 |
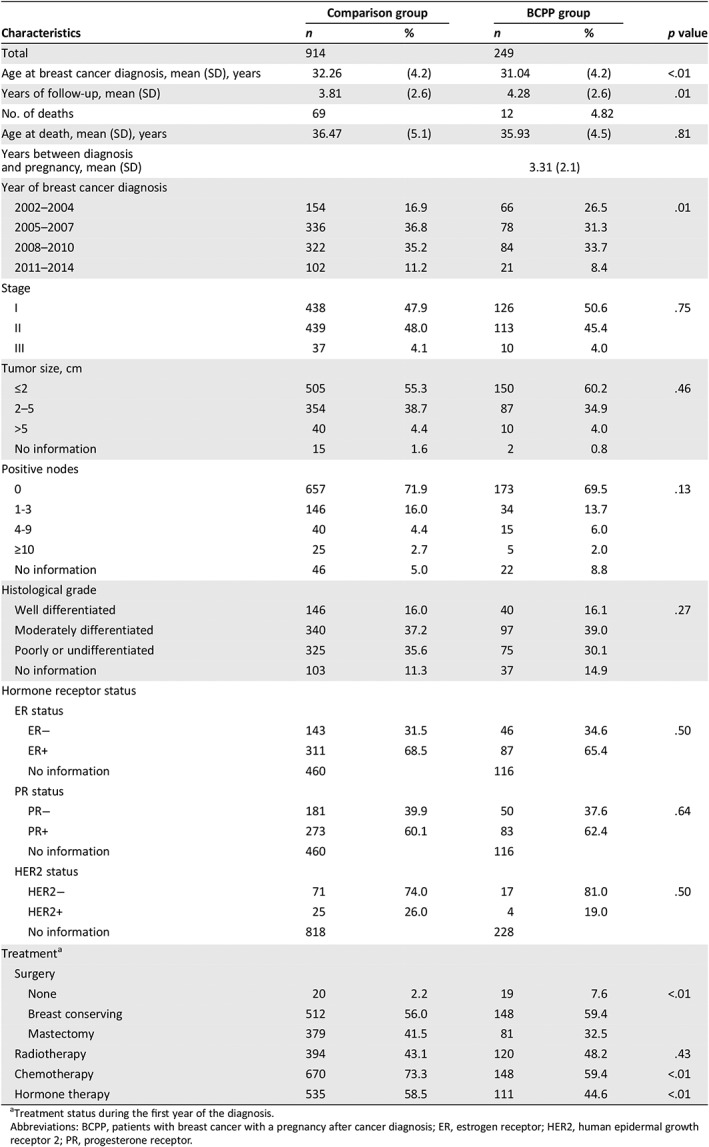
a
Treatment status during the first year of the diagnosis.
Abbreviations: BCPP, patients with breast cancer with a pregnancy after cancer diagnosis; ER, estrogen receptor; HER2, human epidermal growth receptor 2; PR, progesterone receptor.