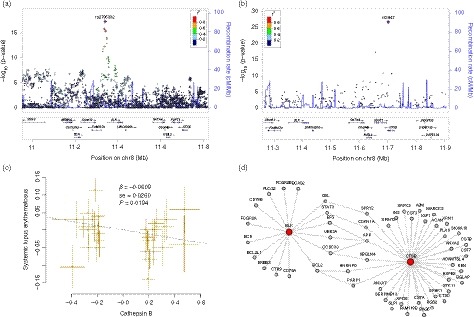
Figure 3.

The relationship between BLK, CTSB and systemic lupus erythematosus (SLE). (a) Regional association plots of the BLK‐CTSB locus. The regional plots were plotted using published data of the SLE genome‐wide association studies (GWAS)4 in the locuszoom website tool (http://locuszoom.sph.umich.edu//). The BLK single nucleotide polymorphisms (SNPs) were significantly associated with SLE, whereas SNPs in the CTSB gene were not. (b) The CTSB SNPs were significantly associated with plasma cathepsin B level, and BLK SNPs also had suggested association evidence. (c) Mendelian randomization analysis showed the causal relationship between plasma cathepsin B level and SLE. (d) Protein–protein interaction analysis showed that BLK might interact with CTSB through several interactors.
