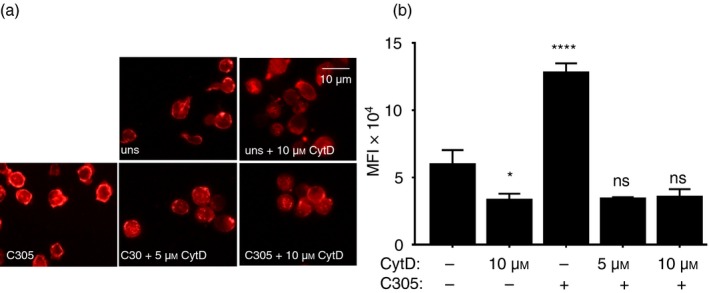
Figure 1.

Inhibition of actin polymerization by cytochalasin D (CytD). Jurkat T cells were treated without or with 5 or 10 µm of CytD for 30 min at 37°. Subsequently, the cells were stimulated for 5 min at 37° with the anti‐T‐cell receptor (TCR) antibody C305 (1 : 50) or left untreated (uns) (a). Cells were stained with rhodamine‐coupled phalloidin to visualize F‐actin formation using fluorescence microscopy. Original magnification is 600×. The fluorescence intensities of cells were quantified by imagej and the mean fluorescence intensity is displayed. Significant differences were determined by unpaired, two‐tailed Student's t‐test. Results were the average of two independent experiments (ns, non‐significant, *P < 0·05, ****P < 0·0001) (b).
