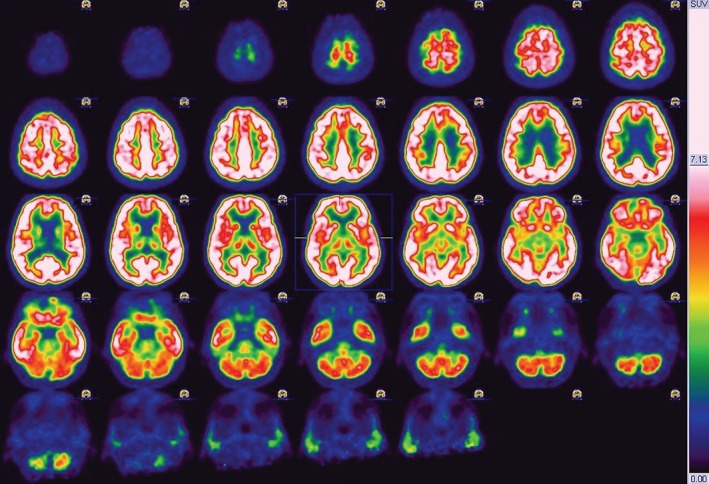
Figure 1.

18‐F‐fluorodeoxyglucose–positron emission tomography showing hypometabolism in the frontobasal parasagittal regions (left > right) in both the thalami and less extensively in the medial temporal regions (left > right) and cerebellum. SUV, XXXXXXXXXX.
