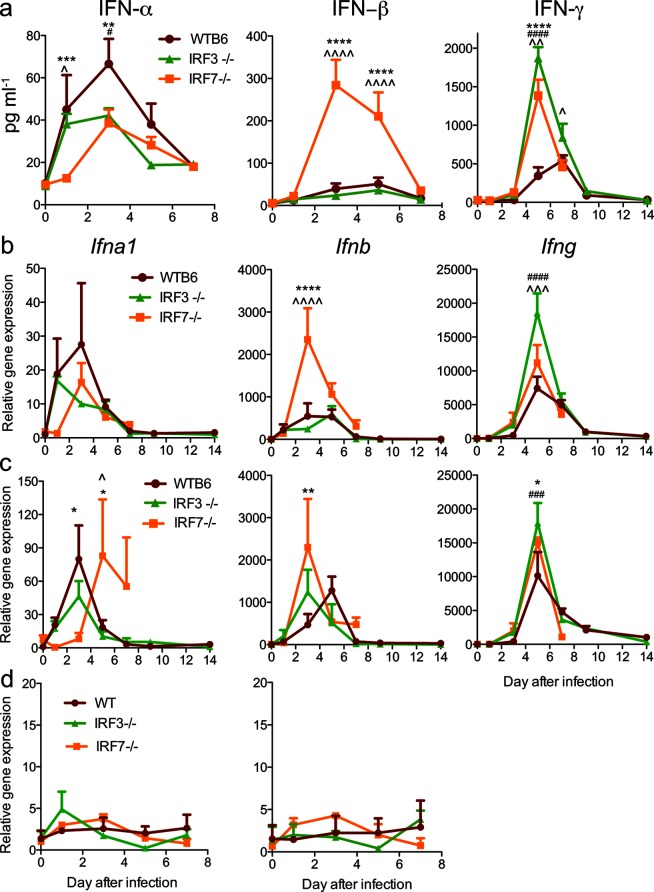
Fig. 4.
Effect of IRF3 and IRF7 deficiencies on the expression of IFN-α, IFN-β and IFN-γ after SINV infection. WT, IRF3−/− and IRF7−/− mice were infected intracranially with 103p.f.u. SINV TE. (a) The protein levels of IFN-α, IFN-β and IFN-γ in the brain were measured by EIA. The expression of Ifna1, Ifnb and Ifng mRNAs was measured by qRT-PCR in the brain (b), spinal cord (c) and draining cervical lymph nodes (d). The data are presented as the mean±SEM of 3–6 mice per strain per time point. Significant differences at each time point determined by Tukey’s (0–7 days p.i.) or Bonferroni’s (9 and 14 days p.i.) post-test are shown (*P<0.05, **P<0.01, ***P<0.001, ****P<0.0001, WT compared to IRF7−/−; # P<0.05, ## P<0.01, ### P<0.001, #### P<0.0001, WT compared to IRF3−/−; ^P<0.05, ^^P<0.01, ^^^P<0.001, ^^^^P<0.0001, IRF3−/− compared to IRF7−/−).

