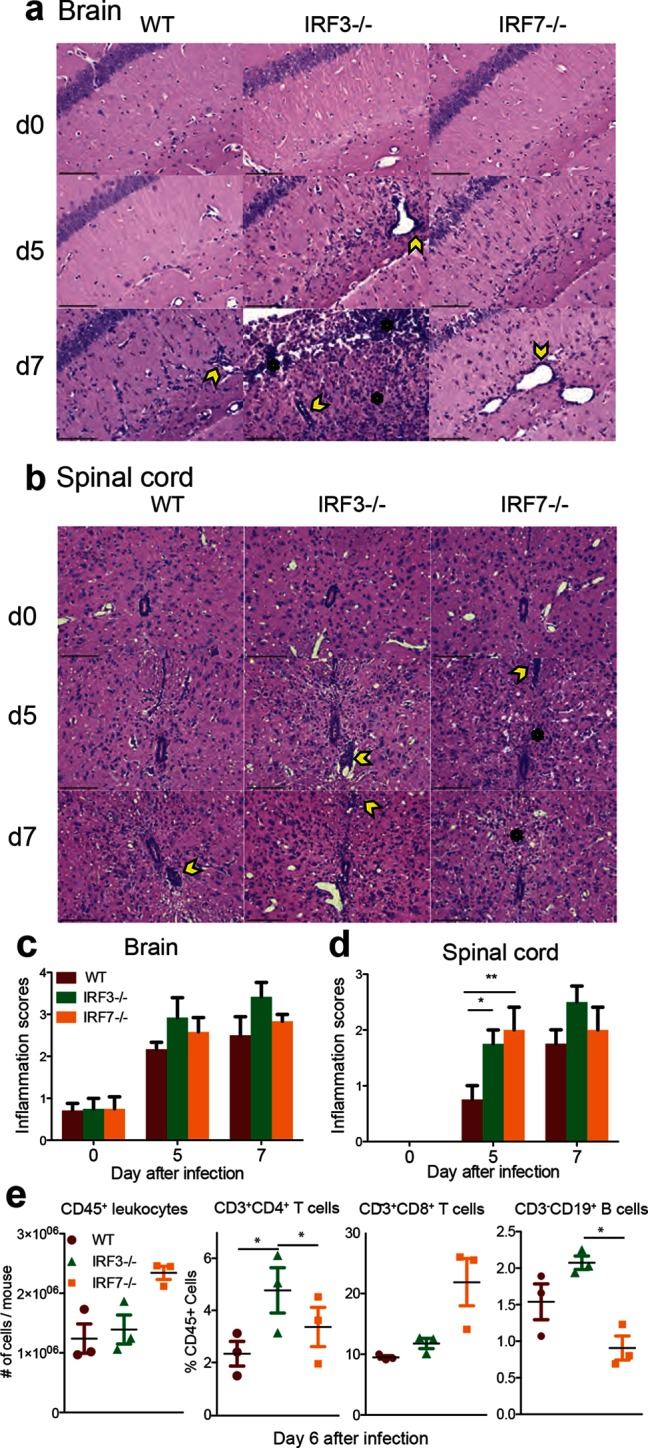
Fig. 7.

Effect of IRF3 or IRF7 deficiency on brain and spinal cord pathology and inflammation after SINV infection. WT, IRF3−/− and IRF7−/− mice were infected intracranially with 103p.f.u. SINV TE. Representative H and E-stained sections of brain (a) and spinal cord (b) from uninfected (d0) and SINV-infected WT, IRF3−/− and IRF7−/− mice at 5 and 7 days after infection. Two hundred× magnification; the scale bar represents 100 µm. The yellow arrowheads denote the perivascular cuffs of inflammatory cells and the black asterisks denote inflammatory cells infiltrating the parenchyma. For quantification, slides were coded and scored for inflammation using a 3 (4) point scale for brain (c) and a 2 (3) point scale for spinal cord (d). The data represent the results of two independent experiments, totalling four mice per strain per time point. *P<0.05, **P<0.01, Tukey’s multiple comparison test. Identification by flow cytometry of cells infiltrating the brain 6 days after infection (e). Numbers of CD45+ cells/brain and the percentages of CD45+ cells that were CD3+CD4+ T cells, CD3+CD8+ T cells or CD3-CD19+ B cells. The data are presented as the mean+/-SEM from three independent experiments with the cells pooled from four to six mice. *P<0.05.
