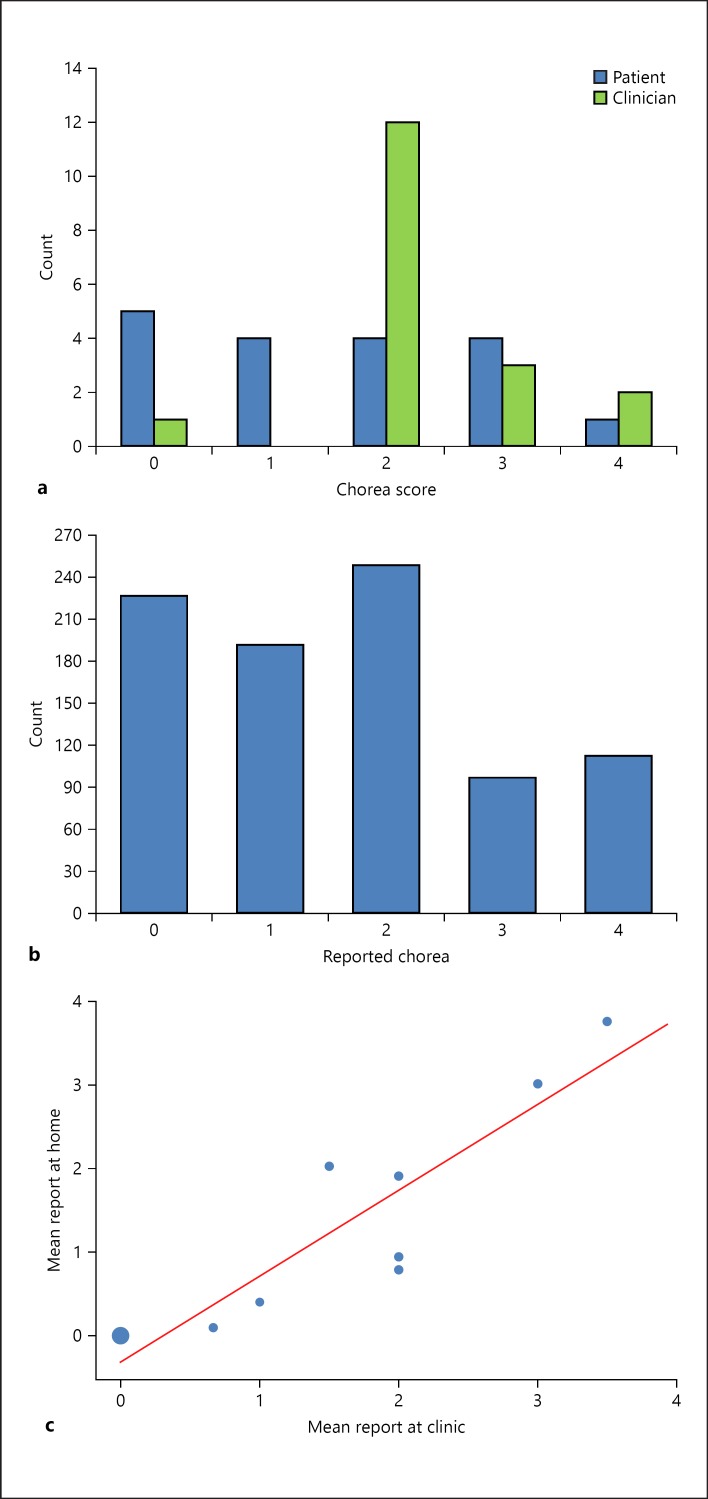
Fig. 2.
In-clinic and home assessment of chorea severity. a Patients' and clinicians' chorea reports following clinic assessment. b Patients' chorea reports following home assessment. c Correlation between patients' chorea reports following home and clinic assessments. Circle size reflects the number of overlapping data points (i.e., the larger circle at 0,0 reflects the higher frequency of times patients ranked chorea severity level as 0 in both the home and clinic assessments).

