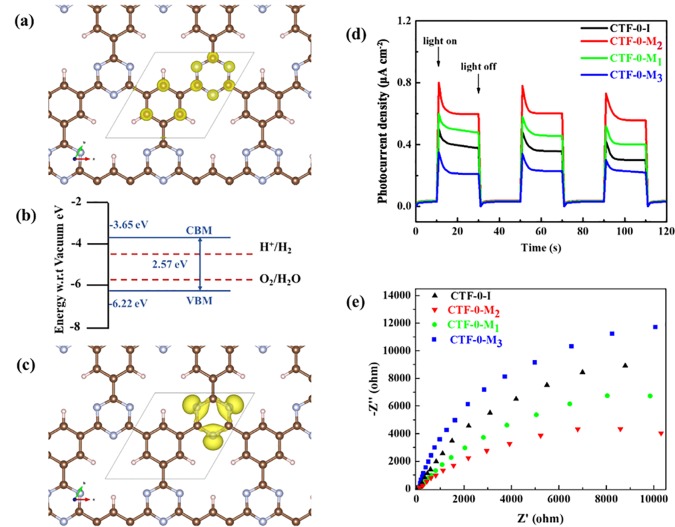
Figure 5.
Spatial distribution of the conduction band minimum (CBM) (a) and valence band maximum (VBM) (c). Isosurface was set to 0.01 e/r03, where r0 is the Bohr radii. Solid lines represent the primary cell of the CTF-0. Band alignments (b) of CTF-0 estimated by DFT calculations. All energies were calculated with reference to the vacuum level. Brown, purple, and pale pink spheres represent carbon, nitrogen, and hydrogen atoms, respectively. Periodic on/off photocurrent response (d) and Nyquist plots (e) of CTF-0-I, CTF-0-M1, CTF-0-M2, and CTF-0-M3 electrodes are in 0.1 M Na2SO4 with 0 V bias versus Ag/AgCl.

