

Abstract

Platinum is a noble metal that is widely used for the electrocatalytic production of hydrogen, but the surface reactivity of platinum toward water is not yet fully understood, even though the effect of water adsorption on the surface free energy of Pt is important in the interpretation of the morphology and catalytic properties of this metal. In this study, we have carried out density functional theory calculations with long-range dispersion corrections [DFT-D3-(BJ)] to investigate the interaction of H2O with the Pt (001), (011), and (111) surfaces. During the adsorption of a single H2O molecule on various Pt surfaces, it was found that the lowest adsorption energy (Eads) was obtained for the dissociative adsorption of H2O on the (001) surface, followed by the (011) and (111) surfaces. When the surface coverage was increased up to a monolayer, we noted an increase in Eads/H2O with increasing coverage for the (001) surface, while for the (011) and (111) surfaces, Eads/H2O decreased. Considering experimental conditions, we observed that the highest coverage was obtained on the (011) surface, followed by the (111) and (001) surfaces. However, with an increase in temperature, the surface coverage decreased on all the surfaces. Total desorption occurred at temperatures higher than 400 K for the (011) and (111) surfaces, but above 850 K for the (001) surface. From the morphology analysis of the Pt nanoparticle, we noted that, when the temperature increased, only the electrocatalytically active (111) surface remained.
1. Introduction
Increasingly, global research is focusing on clean, renewable, and sustainable energy production. Some of the more promising alternative methods for the production of energy include wind,1,2 solar,3,4 hydroelectricity,5−7 or combinations thereof.8−13 Another potentially viable energy source is hydrogen (H2), which is an ideal energy carrier for a variety of fuel cell applications, including in stationary, mobile, and portable power applications.14
H2 gas can be produced via a number of technologies, including from carbon-based fuels15 or from renewable sources such as biomass16 and water.17,18 Among the different routes to the production of H2, the non-carbon-based hybrid sulfur (HyS) cycle has shown itself as a promising, potentially large-scale process.19,20 In this process, the net reaction is the splitting of water into H2 and O2 via the electro-oxidation of SO2/H2SO4. In this system, various anode catalysts have been tested,20 and metallic platinum (Pt) consistently showed both high activity and stability,13,21,22 especially when it was supported on carbon particles. Moreover, Pt is already used as a catalyst23 in a wide variety of reactions, where water acts as a reactant or spectator, influencing the behavior of the surface.24
Water has a complex structure; when monolayers are adsorbed on a surface, it does not only form two-dimensional structures, but it can also create three-dimensional structures resembling bulk liquid water.25 Both computational and experimental works have shown that water molecules on a metal surface are arranged in several layers interacting through an extensive hydrogen-bond network.26,27 It is therefore important in computational studies that appropriate long-range dispersion interactions are included in the calculations to describe accurately the water–metal interface,28,29 for example, by employing density functional theory (DFT) methods with van der Waals corrections.30,31 Another challenge in modeling the adsorption of water on a metallic surface is the high fluctuations in the atomic positions in a liquid, which requires the inclusion of several different configurations32,33 in the initial computational setup. It has been shown34,35 that the most reliable computational results are not necessarily obtained via the addition of more waters to a surface but, more importantly, by considering the way the water molecules interact with each other through the creation of hydrogen bonds and higher-order structures, including hexamers, heptamers, and octamers. However, the detailed description of the binding of water molecules onto Pt surfaces is still not complete, even though it is important for the improvement of the catalytic properties of the Pt material that we understand the fundamental reaction processes that take place on the Pt catalytic surface. The starting point here will be an in-depth understanding of the interactions between the water molecules and the metal surface atoms.
In this paper, we have used DFT calculations to predict the interaction of water with the Pt (001), (011), and (111) surfaces. We examine the electronic properties of the system, including simulated scanning tunneling microscopy (STM) images, the work function, and local densities of states. Surface phase diagrams have also been generated through consideration of the surface free energies and water chemical potential to determine the effects of temperature and pressure on the surface coverage. The aim of our study was the development of a comprehensive understanding of the water–surface chemistry, including adsorption and desorption and the effect of water on the electrocatalytically active surfaces of platinum metal.
2. Computational Methods
2.1. Calculation Details
The Vienna Ab Initio Simulation Package (VASP)36−39 was used to simulate the Pt surfaces and their interactions with water. The projector augmented wave (PAW)40,41 potential was employed to describe the interaction between the valence and the core electrons. The core electrons of Pt and O were defined up to and including the 5p and 1s orbitals, respectively. For the H atoms, all the electrons were treated as valence electrons. The Perdew, Burke, and Ernzerhof (PBE)42,43 functional within the generalized gradient approximation (GGA) was applied in all calculations. Plane waves were included to a cutoff of 400 eV. The Methfessel–Paxton scheme order 145 was used with a smearing of 0.05 eV to determine the partial occupancies during geometry optimization, ensuring an electronic entropy of less than 1 meV·atom–1. However, the tetrahedron method with Blöchl corrections46 was used in the final static simulations to obtain accurate total energies, charges, and density of states. The electronic and ionic optimization criteria were 10–5 eV and 10–2 eV·Å–1, respectively, and the conjugate gradient technique was adopted for the geometry optimizations.
Pt has an Fm3̅m crystal structure.47 The bulk Pt structure was calculated within a primitive face-centered cubic (fcc) cell using a Γ-centered 17 × 17 × 17 Monkhorst-Pack48k-point mesh. Our calculated fcc Pt lattice constant was 3.926 Å, in excellent agreement with the experimental value of 3.924 Å.49,50
The Pt (001), (011), and (111) surfaces were investigated by simulating the periodic p(3 × 3), p(3 × 3), and p(4 × 4) supercells, respectively, which were generated from the bulk using the METADISE code.51 Vacuum of 15 Å, in the z direction, was added to avoid interaction between the neighboring cells. Four atomic layers were considered for the slabs, and the surface areas of the supercells were 138.17, 196.18, and 106.79 Å2 for the (001), (011), and (111) surfaces, respectively. The atoms in the two bottom layers of the supercell were fixed in the calculated bulk locations, and the atoms in the remaining two layers were allowed to relax. A Γ-centered 7 × 7 × 1 Monkhorst-Pack k-point grid was used in all the surfaces to sample the Brillouin zone.
The unrelaxed (γu) and relaxed (γr) surface energies were determined using eqs 1 and 2, respectively
| 1 |
| 2 |
where Eslab, u, Eslab, r, and EPt, bulk are the energies of the unrelaxed slab, the half-relaxed slab, and the bulk, respectively. NPt, slab and Aslab represent the number of Pt atoms in the slab and the surface area of the slab, respectively. The percentage of relaxation (R) was calculated as the difference between the unrelaxed and relaxed surface energies, divided by the unrelaxed surface energy, multiplied by 100.
Atomic charges were obtained using the Bader analysis,52−55 which partitions space into nonspherical atomic regions enclosed by local minima in the charge density. The Tersoff–Hamann56 approach was used to simulate scanning tunneling microscopy (STM) images. In this approach, the tunneling current is proportional to the local density of states (LDOS) of the surface at the position of the tip integrated between the Fermi level and the applied bias. The STM images were mapped in terms of the height as a function of the tip position over the surface using the HIVE57 program.
The isolated H2O molecule was modeled in a periodic box of 12 × 13 × 14 Å3 to ensure negligible interaction with its images of neighboring cells. The Gaussian smearing scheme45 was used during geometry optimization and energy calculations with a smearing of 0.05 eV. A Γ-centered 1 × 1 × 1 Monkhorst-Pack48k-point mesh was also used. Dipole corrections were added in all directions, and the H2O molecule was computed without symmetry.
2.2. Coverage-Dependent Surface Energies
The average adsorption energy Eads per water molecule on the Pt surface was calculated as follows58
| 3 |
where Eslab, rNw ≠ 0, Eslab, r, and Ew are the energies of the slab with the water molecules adsorbed, the clean surface, and the isolated water molecule, respectively. Nw corresponds to the number of adsorbed water molecules.
To determine the thermodynamics of different H2O coverages on Pt (001), (011), and (111) surfaces, the surface free energy (σ) is calculated for different temperatures (T) and H2O chemical potential (μw). The resulting change in surface free energy upon H2O adsorption is denoted as
| 4 |
Surface coverage (θ) represents the number of adsorbed water molecules (Nw) divided by the total number of adsorption sites (N) as
| 5 |
θ = 0 indicates that no adsorption has taken place, while θ =1 shows that adsorption has reached a monolayer.
The chemical potential of molecular H2O in the gas phase can also be expressed as
| 6 |
where Ew is the DFT energy of the H2O molecule,
ΔGw(T, p0) is the Gibbs free energy difference per H2O molecule
between 0 K and T at p0 = 1 bar, which has been extracted from thermodynamic tables.59 The last term ( ) denotes
the free energy change of H2O gas at constant temperature
(T) when the
partial pressure changes from p0 to p. To express the chemical potential, independent of the
calculated quantities, the energy of water was omitted from eq 6 and added to eq 4.
) denotes
the free energy change of H2O gas at constant temperature
(T) when the
partial pressure changes from p0 to p. To express the chemical potential, independent of the
calculated quantities, the energy of water was omitted from eq 6 and added to eq 4.
To determine the effect of H2O adsorption on the Pt (001), (011), and (111) surfaces, Wulff morphologies60 were constructed using the GDIS program.61 The equilibrium Wulff crystal is constructed, assuming that the distance of the crystal face (d001, d011, d111) to the center of the nanoparticle is proportional to their surface free energies as
| 7 |
3. Results and Discussion
3.1. Surface Structures
Figure 1 shows the side and top views of the Pt (001), (011), and (111) surfaces as constructed for our simulations. All three surfaces are planar, bulk-terminated structures, with four layers in each slab. All three surfaces were nonpolar, with the Pt (001) being a smooth surface, Pt (011) being atomically rough and forming channels on the surface, and Pt (111) again being smooth with an fcc arrangement. It has been shown that long-range dispersion approximations influence not only the lattice parameters of a modeled surface, but also the surface energy of the surface.62 To optimize the geometry of the Pt (001), (011), and (111) surfaces, three different long-range dispersion approximations were tested, including (i) without dispersion interactions (DFT), (ii) the DFT-D2 method of Grimme,63 (iii) the zero damping DFT-D3 method of Grimme,64 and (iv) the DFT-D3 method with Becke–Johnson damping.44
Figure 1.
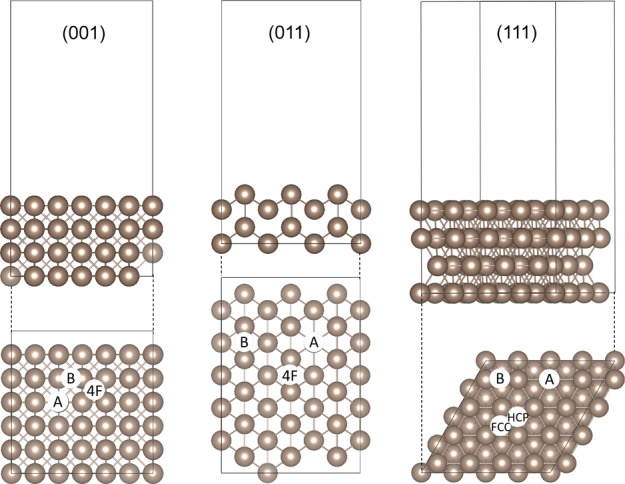
Side and top views of the Pt (001), (011), and (111) surfaces. The symmetrically inequivalent adsorption sites for H2O are indicated, that is, fourfold hollow (4F), bridge (B), atop (A), face-cubic centered (fcc), and hexagonal close packed (hcp) sites. The gold color is used throughout this paper for Pt.
Table 1 shows the lattice parameters, relaxed and unrelaxed surface energies, and the surface areas for the Pt (001), (011), and (111) surfaces, as determined using the different long-range dispersion correction approximations. From the lattice parameters, it was seen that the best correlation was obtained using the DFT-D3(BJ) method, followed by the DFT-D3, DFT, and DFT-D2 methods. The experimental lattice parameter of Pt is 3.925 Å,65 which was overestimated by 0.03 and 1.1% by the DFT-D3(BJ) and standard DFT methods, while with DFT-D3 and DFT-D2, it was under-estimated by 0.2 and 2.1%, respectively. In terms of surface energy, all methods followed the same trend where Pt (111) has the lowest surface energy, followed by the (001) and (011) surfaces. An experimental surface energy of 2.48 J/m2 has been reported in the literature,66 and compared to this prior investigation, the DFT method underestimates the energies by 48, 37, and 65% for the Pt (001), (011), and (111) surfaces, respectively, while DFT-D2 overestimates the energies for all three surfaces by 68, 78, and 60%, respectively. The best correlation for surface energies was with DFT-D3 and DFT-D3(BJ) methods, both of which have less than 18% deviation for all the surfaces with respect to the experiment, which also correlated with the literature.67
Table 1. Lattice Parameters (a) for the Bulk Pt System, Unrelaxed (γu) and Relaxed (γr) Surface Energies, Percentage of Relaxation (R) and the Surface Areas (A) for the Pt (001), (011) and (111) Surfaces Calculated with Several Long-Range Dispersion Correction Methodsa.
| surface | parameter | DFT | DFT-D2 | DFT-D3 | DFT-D3(BJ) | other works |
|---|---|---|---|---|---|---|
| a (Å) | 3.968 | 3.841 | 3.918 | 3.926 | 3.92449,50 | |
| Pt (001) | γu (J/m2) | 1.327 | 4.170 | 2.580 | 2.472 | |
| γr (J/m2) | 1.294 | 4.166 | 2.575 | 2.462 | 1.81,70 2.1769 | |
| R (%) | 2.48 | 0.09 | 0.23 | 0.40 | ||
| A (Å2) | 141.68 | 132.76 | 138.17 | 138.72 | ||
| Φ (eV) | 5.89 | 5.6670 | ||||
| d-band center (eV) | –2.24 | |||||
| Pt (011) | γu (J/m2) | 1.639 | 4.461 | 2.789 | 2.691 | |
| γr (J/m2) | 1.557 | 4.407 | 2.710 | 2.615 | 1.85,70 2.3771 | |
| R (%) | 5.03 | 1.22 | 2.83 | 2.83 | ||
| A (Å2) | 200.36 | 125.16 | 195.40 | 196.18 | ||
| Φ (eV) | 5.49 | 5.2670 | ||||
| d-band center (eV) | –2.00 | |||||
| Pt (111) | γu (J/m2) | 0.871 | 3.961 | 2.209 | 2.055 | |
| γr (J/m2) | 0.866 | 3.961 | 2.193 | 2.046 | 1.49,70 2.4972 | |
| R (%) | 0.62 | 1.05 | 0.72 | 0.43 | ||
| A (Å2) | 109.07 | 102.20 | 106.36 | 106.79 | ||
| Φ (eV) | 5.64 | 5.6970 | ||||
| d-band center (eV) | –2.44 | –2.4573 |
The work function (Φ) and d-band center values for these surfaces were only calculated using the DFT-D3(BJ) method.
A number of calculations were benchmarked using the opt-PBE self-consistent van der Waals functional29,68 and found the lattice parameter of 3.841 Å, which compares to the DFT-D2 method. Furthermore, the unrelaxed (γu) and relaxed (γr) surface energies were underestimated at 1.633 and 1.603 J/m2, respectively, when compared to 2.17 eV obtained with the modified embedded-atom method.69
Taking all of the data into consideration, the DFT-D3(BJ) setting gave the best agreement with the experimental lattice parameter, but a range of different values for the surface energy have been reported. Comparing the surface energy determined with the different methods for the three surfaces to the experimental value of 2.49 J/m2,72 it can be seen that the DFT-D3(BJ) method gave the best agreement and was therefore used in the determination of the surface properties and adsorption energies in the following sections.
The work function, a descriptor inversely related to chemical reactivity, was calculated for the pristine Pt (001), (011), and (111) surfaces (Table 1), where it was determined that removing an electron would be the easiest from the (001) surface, followed by the (111) and (011) surfaces. The literature also reports this tendency,70 with the lowest work function for the (011) surface, followed by (001) and (111) surfaces, which were, however, dependent on the surface area and modeling approximation used. The work function alone cannot be used to predict reactivity though as it is dependent on the surface properties, as well as the temperature.74
The positions of the d-band center have been used before to explain adsorption tendencies on transition metal surfaces.75 The general trend is that the higher in energy the occupied d-states, the stronger the bond with a molecule that accepts electrons from the metal. Among the three surfaces, it was calculated (Table 1) that the Pt (111) surface had the highest d-band center energy, followed by the (001) and (011) surfaces. We found that our calculated d-band center for the Pt (111) surface is in excellent agreement with the value of −2.45 eV reported by Xin et al.73
STM images were simulated for the optimized Pt surfaces and derived from the spatial distribution of the valence band states in the vicinity of the Fermi level (EF). Figure 2 shows our STM images for the Pt (001), (011), and (111) surfaces. For Pt (001), a checker board-like structure can be seen, which is similar to the pattern reported for Cu(100)76 and Ag(100).77 For Pt (011), the grooves formed in the [001] direction on the surface are evident, with every second row higher in the surface shown in a darker color, which means that they are closer to the scanning tip. The alternating rows in the [010] direction are lower and therefore in a lighter gray color. This missing row arrangement was also reported by Feenstra and Hla78 for the isostructural fcc Au (110) surface. The STM image of the Pt (111) shows the honeycomb structure of Pt, as reported in previous experimental findings.79 As these are all pristine surfaces, no deformations or reconstructions were observed.
Figure 2.

Simulated STM images of the Pt (001), (011), and (111) surfaces. The density (ϱ), tip distance (d), and bias (ΔV) are also indicated.
3.2. Single H2O Molecule Adsorption
Figure 1 shows the side and top views of the Pt (001), (011), and (111) surfaces, where we have indicated all the possible unique adsorption sites for H2O. The (001) and (011) surfaces have fourfold hollow (4F), bridge (B), and atop (A) sites, while the (111) surface has bridge (B), top (T), face-centered cubic (fcc), and hexagonal close-packed (hcp) sites. Three different adsorption modes80 were investigated on each surface, one where the H2O molecule is parallel to the Pt surface and all three atoms could interact with the surface, the second where one H was turned upward and only the OH could interact with the surface, and the third where one of the H atoms was turned downward to interact with the Pt surface. All three adsorption modes were investigated for each adsorption site shown in Figure 1.
Water on metal surfaces is usually believed to be intact, except when coadsorbed with other molecules or atoms.82,83 However, a recent DFT study has suggested that a water bilayer on Ru (0001) is half-dissociated, with one O–H bond broken in the dissociated water molecules.84 In another study of water bilayers on Pt, up to 9% of the H2O molecules dissociated.34 Even though it would be less likely to have a single molecule of water dissociate on the surface, it was still decided to include the (001)diss data for both single adsorption and higher surface coverage. For reasons of comparison, it was also decided to include the most stable dissociation configurations on both the (011) and (111) surfaces. The most stable structures found for the adsorption of the water monomer on top of the Pt surfaces are shown in Figure 3, with the bond distances and angles of the adsorbed H2O with respect to the Pt surfaces listed in Table 2.
Figure 3.

Lowest energy adsorption sites of H2O on Pt (001), (011), and (111) surfaces. Pt (001)diss and Pt (001)mol indicate the adsorption of dissociated and molecular H2O, respectively. The atom colors red, white, and gold denote oxygen, hydrogen, and platinum atoms, respectively. The lighter gold color is used to distinguish between the platinum atoms of different layers.
Table 2. Adsorption Energy (Eads), Bond Distance (d), and Angles (∠) as well as the Simulated Wavenumbers (cm–1) of the Fundamental Vibrational Modes of the Adsorbed H2O Molecule on the Pt (001), (011), and (111) Surfacesa.
| parameter | (001)diss | (001)mol | (011)diss | (011)mol | (111)diss | (111)mol | literature |
|---|---|---|---|---|---|---|---|
| Eads (eV) | –1.758 | –1.675 | –0.258 | –0.699 | –0.380 | –0.464 | |
| d (Å) | |||||||
| O–Pt | 2.096 | 2.311 | 2.225 | 2.240 | 2.169 | 2.386 | |
| H–Pt1 | 2.531 | 2.831 | 2.619 | 3.050 | 2.591 | 2.973 | |
| H–Pt2 | 2.956, 1.754 | 2.786 | 3.292, 1.714 | 2.430 | 3.317, 1.873 | 3.164 | |
| ∠ (°) | |||||||
| H–O–H | 104.55 | 103.76 | 104.94 | 104.48b | |||
| Pt–O–H | 104.55 | 97.94 | 102.51 | 99.40 | 104.14 | 97.72 | |
| νasym (cm–1) | 3558 | 3617 | 3620 | 3572 | 3684 | 3756c, 3727d | |
| νsym (cm–1) | 3521 | 3178 | 3574 | 3657c, 3613d | |||
| δ (cm–1) | 1365 | 1547 | 1524 | 1118 | 1553 | 1595c, 1552d | |
| Δq (e) | –0.393 | 0.109 | –0.458 | 0.095 | –0.338 | 0.087 |
On the (001) surface, two very different configurations released the largest adsorption energies, that is, dissociated and molecular H2O, which will be denoted as (001)diss and (001)mol, respectively. In the case of (001)diss, the OH group and dissociated H atom sat in the bridge hollow site, with the O–Pt distance at 2.096 Å, hydroxy H–Pt1 distance at 2.531 Å, and hydroxy H–Pt2 distance at 2.956 Å. The H–Pt2 distance for the dissociated H was 1.754 Å. When associatively adsorbed on Pt (001)mol, the H2O molecule laid parallel to the Pt surface with the H atoms directed toward the bridge hollow position, where the O–Pt distance was 2.311 Å and the H–Pt distances were 2.831 and 2.786 Å for Pt1 and Pt2 (Figure 3), respectively. The H–O–H angle correlated with experimental values at 104.48°,81 suggesting that the water was physisorbed.
On the (011) surface, one of the hydrogens of H2O is pointing along the direction of the ridge it is adsorbed to, whereas the other H points toward the neighboring ridge, as can be seen in Figure 3. The O–Pt distances on the (011) surface are slightly shorter than on the other surfaces, although the H–O–H angle differs by less than 1° from the calculated value for Pt (001). In the dissociated system Pt (011)diss, the OH group is bound at the oxygen to the surrounding Pt atoms on the neighboring ridges, following the direction of the valley. The dissociated H atom is bound in a bridge position between two Pt atoms on the ridge, which was also found by Shi and Sun.85
Similar to the Pt (001)mol adsorption, on the (111) surface, the H2O molecule adsorbs flat, with one H atom directed toward a surface Pt (Pt1) and the other in the direction of an fcc Pt (Pt2) (Figure 3). Carrasco and co-workers30 also showed that the most stable single H2O molecule adsorption was parallel atop the Pt atom. In this work, the O–Pt distance was calculated at 2.386 Å, and the H–O–H angle was calculated at 104.94°, while in the literature, the O–Pt distance was reported as between 2.49 and 2.82 Å, depending on the type of dispersion correction method used in the calculations.30 Similar to our work on the pristine surfaces, Carrasco and co-workers30 have found that, when either no dispersion correction, opt-PBE, or opt-B8829 was added, the O–Pt distance correlated with our work, but when revPBE was used, it was overestimated by 15%. The DFT-D3(BJ)44,64 method we have used is geometry-dependent and therefore accounts for the coordination number of the adsorbed atoms. Our simulations suggest that water may bind more strongly to the Pt (111) surface than was found previously.30 Similar to the (001)diss and (011)diss systems, adsorption of the dissociated H2O on the (111) surface showed that the OH group is in the bridge position, where the oxygen is bound to two neighboring Pt atoms. The dissociated hydrogen was in a neighboring fcc hollow site, which was also reported as energetically the most stable adsorption manner of hydrogen on the Pt (111) surface by Shi and Sun.85
The adsorption energy for a single water molecule, Nw = 1, was calculated to be much larger on the (001) surface than the (011) and (111) surfaces, indicating that adsorption and dissociation are favored on the (001) surface. Carrasco and co-workers30 reported monomer adsorption energies for the Pt (111) surface between −0.24 and −0.40 eV, again depending on the dispersion correction approximation chosen. These values are in fair agreement with our adsorption energy calculated for the (111) surface, again indicating somewhat stronger binding in this study compared to the literature.30 Comparing the adsorption energy of the dissociated water on all the surfaces, it can be seen that it was energetically favored on the (001) surface, followed by the (111) and (011) surfaces. As part of the opt-PBE benchmarking, for the adsorption of both molecular and dissociative adsorption of H2O, we found the values to be slightly endothermic at 0.108 and 0.098 eV, respectively, which differed by more than 0.5 eV from reported values.30
Table 2 lists the simulated wavenumbers of the fundamental vibrational modes of the adsorbed H2O molecule on the (001), (011), and (111) surfaces, which include the asymmetric stretching (νasym), symmetric stretching (νsym), and bending (δ) vibrational modes. For completeness, the data for the dissociated H2O adsorptions were also included. For the dissociated H2O, we can only report the OH stretching at 3558 cm–1, which falls within 100 cm–1 for the stretching and bending modes, when we compare our vibrational results with experimentally measured values.86 Comparing our results with modeled vibrational data, these were again within 60 cm–1 for the single H2O molecule on Pt (111).87 Due to the way the dissociated H2O adsorbed onto the (011) surface, no OH stretching could be calculated.
From the charge analysis in Table 2, in the case of the dissociated H2O, it was observed that electrons between 0.3 and 0.5 e– were transferred from the Pt surfaces to the molecule, whereas in the adsorption of H2O on all three surfaces, the molecule provided ∼0.1 e– to the Pt surface. Figure 4 shows the isosurfaces of the electron density difference between H2O and the Pt surfaces, which was calculated by subtracting the electron density of a pristine Pt surface and that of a single H2O molecule from the total electron density of the modeled system using the same geometries. Yellow and blue represent positive (electron-depleted) and negative (electron-gained) electron densities, respectively. As expected, in the (001)diss system, the dissociated H atom was electron-depleted (Δq = 0.623 e–) relative to the surrounding Pt atoms, whereas the OH part followed a more complex pattern. However, from the Bader charge of each atom, it was seen that the OH group, as a whole, gained electrons (Δq = −1.016 e–). Dissociation on the (111) surface showed similar results, where H was electron-depleted (Δq = 0.639 e–) and the OH group gained electrons (Δq = −0.977 e–). However, even though the (011) surface follows the same trend, the values differ, with H becoming more electron-depleted (Δq = 1.000 e–) and OH gaining nearly another 50% more electron density (Δq = −1.458 e–). In contrast, for molecular adsorption, that is, the (001), (011), and (111) systems, electrons were donated from the molecule to the surface, and as also suggested by the positive Δq values from Table 2, the adsorption energies followed the same trend as the charge transfer values.
Figure 4.

Isosurfaces of the electron density difference between H2O and Pt (001), (011), and (111), both for the molecular and dissociative adsorbed systems. Yellow and blue represent positive (electron-gained) and negative (electron-depleted) electron densities with ±0.00098, ±0.00101, and ± 0.00252 e/Å3 for the molecular isosurfaces and ±0.00255, ±0.00239, and ±0.00276 e/Å3 for the dissociative isosurfaces, respectively, for Pt (001), (011), and (111).
3.3. H2O Surface Coverage
To consider the effect of surface coverage, the number of adsorbed H2O molecules (Nw) was increased until a monolayer was obtained on all Pt surfaces. The lowest energy configurations for single H2O adsorption were used as the initial geometries for the increasing surface coverages. More than 30 configurations for each surface and at different coverages were considered, with the lowest energy configurations shown below. Figure 5 shows the geometries of water molecules with increasing coverages of molecularly adsorbed H2O until full coverage was reached. As the concentration increased, the adsorbed H2O molecules tend to form hexagonal rings when the metal surface allows, as could be expected from the hexagonal structure of water ice I as a result of donor and acceptor hydrogen bonding between water molecules. As already mentioned, owing to the observation of water dissociation on the Pt surface, we considered that it would be interesting to see how H2O would behave in its dissociated state when a surface is fully covered, as shown in Figure 5. However, as the surface coverage increased, the mode of adsorption remained the same; no further dissociation or recombination occurred during the geometry optimizations.
Figure 5.

Molecularly and dissociatively adsorbed H2O coverage on the Pt (001) surface.
Similarly, it was seen on the (011) surface in Figure 6 that the adsorption manner of H2O did not change as the surface coverage increased. Hydrogen bonds formed between every successive H2O, leading to the formation of water strands in the channels of the (011) surface.
Figure 6.

Molecularly adsorbed H2O coverage on the Pt (011) surface.
Figure 7 shows the surface coverage on the (111) surface. Compared to the other surfaces, the mode of adsorption changed the most, explaining the formation of penta- or hexagonal rings on the surface. For all the Pt surfaces, it was seen that, if the subsequent H2O molecules were situated more than one adsorption site away from each other, then the adsorption geometry stayed the same as for the single molecule, suggesting that they behave as isolated adsorbates. However, if the adsorption sites were next to each other, then the geometry changed: the OH fragment would be parallel to the surface with the second H either pointing toward or away from the surface. At higher coverages (θ > 0.5), the H2O molecules formed hexagonal rings on the surfaces, as reported previously in the literature.33,88,89 More hydrogen bonds between the H2O molecules also lead to larger average adsorption energies.
Figure 7.

Molecularly adsorbed H2O coverage on the Pt (111) surface.
Figure 8 shows the calculated average adsorption energy as a function of the surface coverage of H2O. For Pt (001)diss, the value of Eads per water molecule decreased with Nw, which indicates that, although adsorption energies per water molecule remain negative, initial adsorption of isolated water was more favorable than higher coverages. In the case of molecular H2O adsorption Pt (001)mol, Eads decreased with Nw up to 50% surface coverage, after which the adsorption energy stabilized around −0.8 eV/H2O. This trend indicates that this surface has a high affinity to adsorb one to four H2O molecules and that, even with more H2O molecules and a subsequently increase in hydrogen bonds, the energy still plateaued. For both Pt (011) and (111) surfaces, the overall value of Eads increased somewhat as Nw increased, indicating that these two surfaces have the highest affinity for H2O adsorption and full coverage. In this case, more water molecules will cover the surface, which could mean that a catalytic reaction, for instance, between SO2 and H2O could drive the reaction forward to produce more H2.
Figure 8.

Average adsorption energy as a function of the H2O coverage for the Pt (001), (011), and (111) surfaces.
Figure 9 shows the effect of H2O coverage on the surface work function. It can be seen that the trend in the work function is to decrease with increasing surface coverage for all three surfaces. As more H2O molecules are adsorbed, more electrons are transferred to the Pt surface, leading to the reduction of the work function. Similarly to our findings, Meng and co-workers34 reported that the work function decreased from 5.8 to 5.0 when the Pt (111) surface increased its H2O coverage up to θ = 0.7.
Figure 9.

Work function (eV) as a function of H2O coverage for Pt (001), (011), and (111) surfaces.
Another measure of the surface reactivity is the position of the d-band center.90,91 According to this model, a downward shift with respect to the Fermi level, that is, a smaller d-band center value, leads to the formation of a larger number of conduction states, which can accept electrons from the adsorbed H2O molecules. For the pristine surfaces, the d-band center values were in the order of (111) < (001) < (011), which is in line with the surface energies. However, after adsorption of more H2O molecules, no distinct correlation was found in this instance. Although it has been shown previously that there is a link between the electronic and electrocatalytic properties of transition metals, the relationship between the d-band center and electrocatalytic activity is more complex and does not always show a direct correlation.92
To distinguish between the two competing processes, dissociation and association (i.e., molecular adsorption), and the most likely adsorption mode to occur, the thermodynamic effect of water coverage on the different Pt surfaces was investigated. Equation 6 was used to quantify the relationship between the pressure and the chemical potential at different temperatures. In Figure 10a, we plot the H2O pressure against the chemical potential at different temperatures, while in Figure 10b,c, we present the effect of the coverage on the surface free energies in terms of the chemical potential (μw/eV) for the dissociatively and molecularly adsorbed H2O molecules on the Pt (001) surface. The region between the dashed lines represents the chemical potential of the experimental conditions, where the HyS cycle is operated at an ambient pressure of 1 atm and 298–400 K.
Figure 10.

(a) Pressure (log P) versus chemical potential (μw) of H2O at different temperatures and (b, c) effect of surface energy (Δσ) versus chemical potential as a function of increased coverage for the molecularly and dissociatively adsorbed H2O molecules on the Pt (001) surface. The region between the dashed lines represents the experimental conditions for the HyS cycle (1 atm, 298–400 K).
In Figure 10b, each colored line represents different coverages of the dissociated H2O molecule on the (001) surface as a function of the surface energy and chemical potential. Overall, it was found that the pressure did not have a significant effect on the behavior of the surfaces. As the chemical potential decreases, the surface energy increases until total dehydration of the surface occurs. Under the HyS cycle reaction conditions, the (001) surface has a coverage of 2.16 H2O·nm–2. If the temperature decreases or pressure increases, the surface coverage decreases to 0.72 H2O·nm–2, but even at low temperatures, the surface does not form a monolayer of dissociated H2O.
Similarly, for the molecularly adsorbed water molecules on the Pt (001) surface (Figure 10c), we observe that, as the chemical potential decreases, the surface energy increases. In the experimental region, irrespective of temperature or pressure, the surface coverage was 6.49 H2O·nm–2, that is, much higher coverage than for the dissociated water molecule. Molecular and ensuing dissociative water adsorptions are, to some extent, competing processes. Although we have considered the processes separately, rather than in a system containing both types of adsorption, the results shown in Figure 10b,c indicate that it is unlikely that all H2O molecules on the (001) surface will dissociate. Although dissociation of one H2O was favored on the (001) surface, subsequent water adsorption beyond a fairly low coverage is likely to remain bound molecularly. The chemical potential versus surface energy graphs for the (011) and (111) surfaces are displayed in the Supporting Information.
Figure 11 shows surface phase diagrams, which are constructed by considering the effect of pressure and temperature on the H2O coverages. The (001)mol system shows that, under the HyS cycle reaction (experimental) conditions, the surface will have a full coverage. The coverage changes from θ = 1 to 0.22 for temperatures higher than 400 K, and we see that complete desorption occurs at temperatures higher than 850 K. The (011) surface has full coverage at low temperatures, but as the temperature increases, especially in the region between 400 and 450 K, the coverage changes from 1 to 0. In contrast to these two surfaces, the (111) surface has only two surface coverages, either fully hydrated or dry, depending on the temperature. Complete water desorption occurs around 1 atm and 425 K.
Figure 11.

Surface phase diagrams in terms of pressure and temperature for molecular water adsorption at the Pt (001), (011), and (111) surfaces.
Under the HyS cycle reaction conditions, adsorption of water to full coverage will occur on all pristine Pt surfaces. However, if the temperature during an experiment were to increase above 400 K, the water will start to desorb from the surface. Further temperature increases, that is, from 450 K for (011) and (111), and 800 K for (001), will dry out the catalyst, which will make it unsuitable for the electro-oxidation of SO2 as no H2O will be present. This, in turn, will impact negatively on the efficiency of the HyS cycle. Comparing our results with experimental thermal desorption values, it has been reported that, even at the lowest coverages, water desorbs from the (111) surface in two peaks, 179 and 196 K, and at higher coverages, there are three distinct peaks from physisorbed water, 160–167, 170–171, and 177–180 K, ascribed to multilayer ice, a bilayer region, and a nonbilayer region, respectively.93,94
If the surface energies are used to construct nanoparticle morphologies, following the Wulff construction method,60 we can visualize the effect of the water chemical potential on the Pt nanoparticles (Figure 12). The dry morphology was constructed from the free energies of the surfaces without adsorbed H2O molecules. The dry nanoparticle shows all three major Pt surfaces, producing a rhombicuboctahedron structure with 8 truncated triangular (111) faces, 12 truncated (011) faces, and 6 square (001) faces.
Figure 12.

Wulff morphology of Pt nanoparticles: dry and hydrated at a temperature of 0 K and higher than 298.15 K.
The hydrated Wulff morphologies were constructed using surface free energies, taking both the temperature and pressure of the adsorbed H2O into account. Looking at the morphology constructed at 0 K, only the (001) and (111) surfaces are expressed. This truncated octahedron (six square and eight hexagonal faces) was also reported by Shi and Sun85 at 0 K, where the nanoparticle expressed 86% of the (111) surface and 14% of the (110) surface. Three temperatures (298.15, 400, and 800 K) at pH2O = 1 atm were chosen to present the effect of temperature change on the Pt morphology. An increase in temperature changed the Pt morphology to one where only the (111) surface was expressed at all these temperatures, shown as the third octahedron morphology (eight triangular faces) in Figure 12. Zhu and co-workers95 also utilized the DFT-GGA method to optimize varying sizes of Pt surfaces to construct Wulff morphologies and reported that the vapor pressure and temperature had a significant effect on the shape of the Pt nanoparticle. In another experimental study by Lee et al.,96 it was seen that colloidal particles of Pt preferentially expressed the (001) and (111) facets. However, in Lee’s study, all three Miller indexes were expressed to varying extent in the nanoparticles, depending on the temperature.
4. Conclusions
In this paper, we have used density functional theory calculations to predict the interaction of H2O with the Pt (001), (011), and (111) surfaces. It was determined that the DFT-D3(BJ) dispersion method provides the best surface energies and lattice parameter when compared to experimental values. When considering adsorption of an isolated H2O molecule, it adsorbs dissociatively on the (001) surface, whereas on both the (011) and (111) surfaces, the H2O molecule adsorbs parallel atop the Pt atoms. Bader analysis shows that the molecularly bound H2O provides ∼0.1 e– to the Pt surface, while ∼0.4 e– was transferred from the surface to the molecule when it dissociates.
Surface coverage was increased until a monolayer was obtained, where Eads/H2O decreased for the (001) surface as the coverage increased, while for the (011) and (111) surfaces, Eads/H2O increased. Under the conditions at which the HyS reaction takes place, the highest coverage was obtained for the (011) surface, followed by (111) and (001). The Wulff morphology of the Pt nanoparticle showed that, in a dry environment, all three surfaces are expressed. However, in a hydrated environment and with increasing temperature, the percentage of the expressed (001) and (011) faces changes until only the (111) surface is present.
Future work will include the consideration of SO2 on various Pt surfaces, as well as a mixture of H2O and SO2. In addition, we will also investigate the mechanism of the SO2 oxidation on the Pt surfaces.
Acknowledgments
We acknowledge the Economic and Social Research Council (ESRC grant no. ES/N013867/1) and the Engineering and Physical Sciences Research Council (EPSRC grant nos. EP/K016288/1 and EP/K009567/2). This work was performed using the computational facilities of the Advanced Research Computing at Cardiff (ARCCA) Division, Cardiff University, and the Centre of High Performance Computing (CHPC) in Cape Town, South Africa. In addition, the calculations were carried out using the Supercomputing Facilities at Cardiff University operated by ARCCA on behalf of the HPC Wales and Supercomputing Wales (SCW) projects. We acknowledge the support of the latter, which is part-funded by the European Regional Development Fund (ERDF) via the Welsh Government. We wish to acknowledge the use of the EPSRC-funded National Chemical Database Service hosted by the Royal Society of Chemistry. D.S.-C. is grateful to the Department of Science and Technology (DST) and the National Research Foundation (NRF) of South Africa for the provision of a Postdoctoral Fellowship for Early Career Researchers from U.K. M.J.U. would like to acknowledge the National Research Foundation (NRF grant no. 116728) for their financial support and the North-West University for their support and resources. All data created during this research are openly available from Cardiff University’s Research Portal at http://dx.doi.org/10.17035/d.2019.0068143277.
Supporting Information Available
The Supporting Information is available free of charge on the ACS Publications website at DOI: 10.1021/acs.jpcc.9b06136.
Graph showing the d-band center values versus H2O coverage on the Pt (001)diss, (001)mol, (011) and (111) surfaces; and graph showing the effect of surface energy versus chemical potential as a function of increased coverage for Pt (011) and (111) (PDF)
The authors declare no competing financial interest.
Supplementary Material
References
- Dai K.; Bergot A.; Liang C.; Xiang W.-N.; Huang Z. Environmental Issues Associated with Wind Energy – A Review. Renewable Energy 2015, 75, 911–921. 10.1016/j.renene.2014.10.074. [DOI] [Google Scholar]
- Harvey L. D. D. The Potential of Wind Energy to Largely Displace Existing Canadian Fossil Fuel and Nuclear Electricity Generation. Energy 2013, 50, 93–102. 10.1016/j.energy.2012.12.008. [DOI] [Google Scholar]
- Bahadori A.; Nwaoha C. A Review on Solar Energy Utilisation in Australia. Renewable Sustainable Energy Rev. 2013, 18, 1–5. 10.1016/j.rser.2012.10.003. [DOI] [Google Scholar]
- Sarver T.; Al-Qaraghuli A.; Kazmerski L. L. A Comprehensive Review of the Impact of Dust on the Use of Solar Energy: History, Investigations, Results, Literature, and Mitigation Approaches. Renewable Sustainable Energy Rev. 2013, 22, 698–733. 10.1016/j.rser.2012.12.065. [DOI] [Google Scholar]
- Kaldellis J. K. The Contribution of Small Hydro Power Stations to the Electricity Generation in Greece: Technical and Economic Considerations. Energy Policy 2007, 35, 2187–2196. 10.1016/j.enpol.2006.06.021. [DOI] [Google Scholar]
- Philpott A.; Guan Z.; Khazaei J.; Zakeri G. Production Inefficiency of Electricity Markets with Hydro Generation. Util. Policy 2010, 18, 174–185. 10.1016/j.jup.2010.09.001. [DOI] [Google Scholar]
- Rehman S.; Al-Hadhrami L. M.; Alam M. M. Pumped Hydro Energy Storage System: A Technological Review. Renewable Sustainable Energy Rev. 2015, 44, 586–598. 10.1016/j.rser.2014.12.040. [DOI] [Google Scholar]
- Angarita J. L.; Usaola J.; Martínez-Crespo J. Combined Hydro-Wind Generation Bids in a Pool-Based Electricity Market. Electr. Power Syst. Res. 2009, 79, 1038–1046. 10.1016/j.epsr.2009.01.002. [DOI] [Google Scholar]
- Suomalainen K.; Pritchard G.; Sharp B.; Yuan Z.; Zakeri G. Correlation Analysis on Wind and Hydro Resources with Electricity Demand and Prices in New Zealand. Appl. Energy 2015, 137, 445–462. 10.1016/j.apenergy.2014.10.015. [DOI] [Google Scholar]
- Santos-Alamillos F. J.; Pozo-Vázquez D.; Ruiz-Arias J. A.; Von Bremen L.; Tovar-Pescador J. Combining Wind Farms with Concentrating Solar Plants to Provide Stable Renewable Power. Renewable Energy 2015, 76, 539–550. 10.1016/j.renene.2014.11.055. [DOI] [Google Scholar]
- Ahmed N. A.; Miyatake M.; Al-Othman A. K. Power Fluctuations Suppression of Stand-Alone Hybrid Generation Combining Solar Photovoltaic/Wind Turbine and Fuel Cell Systems. Energy Convers. Manage. 2008, 49, 2711–2719. 10.1016/j.enconman.2008.04.005. [DOI] [Google Scholar]
- Vick B. D.; Moss T. A. Adding Concentrated Solar Power Plants to Wind Farms to Achieve a Good Utility Electrical Load Match. Sol. Energy 2013, 92, 298–312. 10.1016/j.solener.2013.03.007. [DOI] [Google Scholar]
- Colón-Mercado H. R.; Hobbs D. T. Catalyst Evaluation for a Sulfur Dioxide-Depolarized Electrolyzer. Electrochem. Commun. 2007, 9, 2649–2653. 10.1016/j.elecom.2007.08.015. [DOI] [Google Scholar]
- de Bruijn F. The Current Status of Fuel Cell Technology for Mobile and Stationary Applications. Green Chem. 2005, 7, 132–150. 10.1039/b415317k. [DOI] [Google Scholar]
- Cormos C.-C. Hydrogen Production from Fossil Fuels with Carbon Capture and Storage Based on Chemical Looping Systems. Int. J. Hydrogen Energy 2011, 36, 5960–5971. 10.1016/j.ijhydene.2011.01.170. [DOI] [Google Scholar]
- Ni M.; Leung D. Y. C.; Leung M. K. H.; Sumathy K. An Overview of Hydrogen Production from Biomass. Fuel Process. Technol. 2006, 87, 461–472. 10.1016/j.fuproc.2005.11.003. [DOI] [Google Scholar]
- Acar C.; Dincer I.; Naterer G. F. Review of Photocatalytic Water-Splitting Methods for Sustainable Hydrogen Production. Int. J. Energy Res. 2016, 40, 1449–1473. 10.1002/er.3549. [DOI] [Google Scholar]
- Ursua A.; Gandía L. M.; Sanchis P. Hydrogen Production From Water Electrolysis: Current Status and Future Trends. Proc. IEEE 2012, 100, 410–426. 10.1109/JPROC.2011.2156750. [DOI] [Google Scholar]
- Xue L.; Zhang P.; Chen S.; Wang L. Pt-Based Bimetallic Catalysts for SO2-Depolarized Electrolysis Reaction in the Hybrid Sulfur Process. Int. J. Hydrogen Energy 2014, 39, 14196–14203. 10.1016/j.ijhydene.2014.02.128. [DOI] [Google Scholar]
- O’Brien J. A.; Hinkley J. T.; Donne S. W.; Lindquist S. E. The Electrochemical Oxidation of Aqueous Sulfur Dioxide: A Critical Review of Work with Respect to the Hybrid Sulfur Cycle. Electrochim. Acta 2010, 55, 573–591. 10.1016/j.electacta.2009.09.067. [DOI] [Google Scholar]
- Appleby A.; Pinchon B. Electrochemical Aspects of the H2SO4—SO2 Thermoelectrochemical Cycle for Hydrogen Production. Int. J. Hydrogen Energy 1980, 5, 253–267. 10.1016/0360-3199(80)90070-1. [DOI] [Google Scholar]
- Lu P. W. T.; Ammon R. L. An Investigation of Electrode Materials for the Anodic Oxidation of Sulfur Dioxide in Concentrated Sulfuric Acid. J. Electrochem. Soc. 1980, 127, 2610. 10.1149/1.2129530. [DOI] [Google Scholar]
- Sui S.; Wang X.; Zhou X.; Su Y.; Riffat S.; Liu C. A Comprehensive Review of Pt Electrocatalysts for the Oxygen Reduction Reaction: Nanostructure, Activity, Mechanism and Carbon Support in PEM Fuel Cells. J. Mater. Chem. A 2017, 5, 1808–1825. 10.1039/C6TA08580F. [DOI] [Google Scholar]
- Luo H.; Park S.; Chan H. Y. H.; Weaver M. J. Surface Oxidation of Platinum-Group Transition Metals in Ambient Gaseous Environments: Role of Electrochemical versus Chemical Pathways. J. Phys. Chem. B 2000, 104, 8250–8258. 10.1021/jp001289+. [DOI] [Google Scholar]
- Brini E.; Fennell C. J.; Fernandez-Serra M.; Hribar-Lee B.; Lukšič M.; Dill K. A. How Water’s Properties Are Encoded in Its Molecular Structure and Energies. Chem. Rev. 2017, 117, 12385–12414. 10.1021/acs.chemrev.7b00259. [DOI] [PMC free article] [PubMed] [Google Scholar]
- Björneholm O.; Hansen M. H.; Hodgson A.; Liu L. M.; Limmer D. T.; Michaelides A.; Pedevilla P.; Rossmeisl J.; Shen H.; Tocci G.; et al. Water at Interfaces. Chem. Rev. 2016, 116, 7698–7726. 10.1021/acs.chemrev.6b00045. [DOI] [PubMed] [Google Scholar]
- Schnur S.; Groß A. Properties of Metal–Water Interfaces Studied from First Principles. New J. Phys. 2009, 11, 125003. 10.1088/1367-2630/11/12/125003. [DOI] [Google Scholar]
- Forster-Tonigold K.; Groß A. Dispersion Corrected RPBE Studies of Liquid Water. J. Chem. Phys. 2014, 141, 064501. 10.1063/1.4892400. [DOI] [PubMed] [Google Scholar]
- Klimeš J.; Bowler D. R.; Michaelides A. Chemical Accuracy for the van Der Waals Density Functional. J. Phys. Condens. Matter 2010, 22, 022201. 10.1088/0953-8984/22/2/022201. [DOI] [PubMed] [Google Scholar]
- Carrasco J.; Klimeš J.; Michaelides A. The Role of van Der Waals Forces in Water Adsorption on Metals. J. Chem. Phys. 2013, 138, 024708 10.1063/1.4773901. [DOI] [PubMed] [Google Scholar]
- Tkatchenko A.; Scheffler M. Accurate Molecular Van Der Waals Interactions from Ground-State Electron Density and Free-Atom Reference Data. Phys. Rev. Lett. 2009, 102, 073005 10.1103/PhysRevLett.102.073005. [DOI] [PubMed] [Google Scholar]
- Bellarosa L.; García-Muelas R.; Revilla-López G.; López N. Diversity at the Water-Metal Interface: Metal, Water Thickness, and Confinement Effects. ACS Cent. Sci. 2016, 2, 109–116. 10.1021/acscentsci.5b00349. [DOI] [PMC free article] [PubMed] [Google Scholar]
- Carrasco J.; Hodgson A.; Michaelides A. A Molecular Perspective of Water at Metal Interfaces. Nat. Mater. 2012, 11, 667–674. 10.1038/nmat3354. [DOI] [PubMed] [Google Scholar]
- Meng S.; Wang E. G.; Gao S. Water Adsorption on Metal Surfaces: A General Picture from Density Functional Theory Studies. Phys. Rev. B 2004, 69, 195404. 10.1103/PhysRevB.69.195404. [DOI] [Google Scholar]
- Kenmoe S.; Biedermann P. U. Water Aggregation and Dissociation on the ZnO(101̅0) Surface. Phys. Chem. Chem. Phys. 2017, 19, 1466–1486. 10.1039/C6CP07516A. [DOI] [PubMed] [Google Scholar]
- Kresse G.; Hafner J. Ab Initio Molecular Dynamics for Liquid Metals. Phys. Rev. B 1993, 47, 558–561. 10.1103/PhysRevB.47.558. [DOI] [PubMed] [Google Scholar]
- Kresse G.; Hafner J. Ab Initio Molecular-Dynamics Simulation of the liquid-metal–amorphous-semiconductor Transition in Germanium. Phys. Rev. B 1994, 49, 14251–14269. 10.1103/PhysRevB.49.14251. [DOI] [PubMed] [Google Scholar]
- Kresse G.; Furthmüller J. Efficient Iterative Schemes for Ab Initio Total-Energy Calculations Using a Plane-Wave Basis Set. Phys. Rev. B 1996, 54, 11169–11186. 10.1103/PhysRevB.54.11169. [DOI] [PubMed] [Google Scholar]
- Kresse G.; Furthmüller J. Efficiency of Ab-Initio Total Energy Calculations for Metals and Semiconductors Using a Plane-Wave Basis Set. Comput. Mater. Sci. 1996, 6, 15–50. 10.1016/0927-0256(96)00008-0. [DOI] [PubMed] [Google Scholar]
- Blöchl P. E. Projector Augmented-Wave Method. Phys. Rev. B 1994, 50, 17953–17979. 10.1103/PhysRevB.50.17953. [DOI] [PubMed] [Google Scholar]
- Kresse G.; Joubert D. From Ultrasoft Pseudopotentials to the Projector Augmented-Wave Method. Phys. Rev. B 1999, 59, 1758–1775. 10.1103/PhysRevB.59.1758. [DOI] [Google Scholar]
- Perdew J. P.; Burke K.; Ernzerhof M. Generalized Gradient Approximation Made Simple. Phys. Rev. Lett. 1996, 77, 3865–3868. 10.1103/PhysRevLett.77.3865. [DOI] [PubMed] [Google Scholar]
- Perdew J. P.; Burke K.; Ernzerhof M. Generalized Gradient Approximation Made Simple [Phys. Rev. Lett. 77, 3865 (1996)]. Phys. Rev. Lett. 1997, 78, 1396. 10.1103/PhysRevLett.78.1396. [DOI] [PubMed] [Google Scholar]
- Grimme S.; Ehrlich S.; Goerigk L. Effect of the Damping Function in Dispersion Corrected Density Functional Theory. J. Comput. Chem. 2011, 32, 1456–1465. 10.1002/jcc.21759. [DOI] [PubMed] [Google Scholar]
- Methfessel M.; Paxton A. T. High-Precision Sampling for Brillouin-Zone Integration in Metals. Phys. Rev. B 1989, 40, 3616–3621. 10.1103/PhysRevB.40.3616. [DOI] [PubMed] [Google Scholar]
- Blöchl P. E.; Jepsen O.; Andersen O. K. Improved Tetrahedron Method for Brillouin-Zone Integrations. Phys. Rev. B 1994, 49, 16223–16233. 10.1103/PhysRevB.49.16223. [DOI] [PubMed] [Google Scholar]
- Corbel G.; Topić M.; Gibaud A.; Lang C. I. Selective Dry Oxidation of the Ordered Pt-11.1 at.% v Alloy Surface Evidenced by in Situ Temperature-Controlled X-Ray Diffraction. J. Alloys Compd. 2011, 509, 6532–6538. 10.1016/j.jallcom.2011.03.079. [DOI] [Google Scholar]
- Monkhorst H. J.; Pack J. D. Special Points for Brillouin-zone Integrations. Phys. Rev. B 1976, 13, 5188–5192. 10.1103/PhysRevB.13.5188. [DOI] [Google Scholar]
- Arblaster J. W. Crystallographic Properties of Platinum. Platinum Met. Rev. 1997, 41, 12–21. [Google Scholar]
- Arblaster J. W. Crystallographic Properties of Platinum: New Methodology and Erratum. Platinum Met. Rev. 2006, 50, 118–119. 10.1595/147106706X129088. [DOI] [Google Scholar]
- Watson G. W.; Kelsey E. T.; de Leeuw N. H.; Harris D. J.; Parker S. C. Atomistic Simulation of Dislocations, Surfaces and Interfaces in MgO. J. Chem. Soc., Faraday Trans. 1996, 92, 433. 10.1039/ft9969200433. [DOI] [Google Scholar]
- Henkelman G.; Arnaldsson A.; Jónsson H. A Fast and Robust Algorithm for Bader Decomposition of Charge Density. Comput. Mater. Sci. 2006, 36, 354–360. 10.1016/j.commatsci.2005.04.010. [DOI] [Google Scholar]
- Sanville E.; Kenny S. D.; Smith R.; Henkelman G. Improved Grid-Based Algorithm for Bader Charge Allocation. J. Comput. Chem. 2007, 28, 899–908. 10.1002/jcc.20575. [DOI] [PubMed] [Google Scholar]
- Tang W.; Sanville E.; Henkelman G. A Grid-Based Bader Analysis Algorithm without Lattice Bias. J. Phys. Condens. Matter 2009, 21, 084204 10.1088/0953-8984/21/8/084204. [DOI] [PubMed] [Google Scholar]
- Yu M.; Trinkle D. R. Accurate and Efficient Algorithm for Bader Charge Integration. J. Chem. Phys. 2011, 134, 064111 10.1063/1.3553716. [DOI] [PubMed] [Google Scholar]
- Tersoff J.; Hamann D. R. Theory of the Scanning Tunneling Microscope. Phys. Rev. B 1985, 31, 805–813. 10.1103/PhysRevB.31.805. [DOI] [PubMed] [Google Scholar]
- Vanpoucke D. E. P.; Brocks G. Pt-Induced Nanowires on Ge(001): A Density Functional Theory Study. Phys. Rev. B 2010, 81, 085410 10.1103/PhysRevB.81.085410. [DOI] [Google Scholar]
- Santos-Carballal D.; Roldan A.; Grau-Crespo R.; de Leeuw N. H. A DFT Study of the Structures, Stabilities and Redox Behaviour of the Major Surfaces of Magnetite Fe3O4. Phys. Chem. Chem. Phys. 2014, 16, 21082–21097. 10.1039/C4CP00529E. [DOI] [PubMed] [Google Scholar]
- Chase M. W.NIST-JANAF Thermochemical Tables; 4th edition; American Institute of Physics,1998; Vol. Monograph. [Google Scholar]
- Wulff G. XXV. Zur Frage Der Geschwindigkeit Des Wachsthums Und Der Auflösung Der Krystallflächen. Z. Kristallogr. Cryst. Mater 1901, 34, 449–530. 10.1524/zkri.1901.34.1.449. [DOI] [Google Scholar]
- Fleming S.; Rohl A. GDIS: A visualization Program for Molecular and Periodic Systems. Z. Kristallogr. Cryst. Mater. 2005, 220, 580–584. 10.1524/zkri.220.5.580.65071. [DOI] [Google Scholar]
- Posada-Pérez S.; Santos-Carballal D.; Terranova U.; Roldan A.; Illas F.; de Leeuw N. H. CO2 interaction with Violarite (FeNi2S4) Surfaces: A Dispersion-Corrected DFT Study. Phys. Chem. Chem. Phys. 2018, 20, 20439–20446. 10.1039/C8CP03430C. [DOI] [PubMed] [Google Scholar]
- Grimme S. Semiempirical GGA-Type Density Functional Constructed with a Long-Range Dispersion Correction. J. Comput. Chem. 2006, 27, 1787–1799. 10.1002/jcc.20495. [DOI] [PubMed] [Google Scholar]
- Grimme S.; Antony J.; Ehrlich S.; Krieg H. A Consistent and Accurate Ab Initio Parametrization of Density Functional Dispersion Correction (DFT-D) for the 94 Elements H-Pu. J. Chem. Phys. 2010, 132, 154104. 10.1063/1.3382344. [DOI] [PubMed] [Google Scholar]
- Getman R. B.; Xu Y.; Schneider W. F. Thermodynamics of Environment-Dependent Oxygen Chemisorption on Pt(111). J. Phys. Chem. C 2008, 112, 9559–9572. 10.1021/jp800905a. [DOI] [Google Scholar]
- Skriver H. L.; Rosengaard N. M. Surface Energy and Work Function of Elemental Metals. Phys. Rev. B 1992, 46, 7157–7168. 10.1103/PhysRevB.46.7157. [DOI] [PubMed] [Google Scholar]
- Santos-Carballal D.; Ngoepe P. E.; de Leeuw N. H. Ab Initio Investigation of the Thermodynamics of Cation Distribution and of the Electronic and Magnetic Structures in the LiMn2O4 Spinel. Phys. Rev. B 2018, 97, 085126. 10.1103/PhysRevB.97.085126. [DOI] [Google Scholar]
- Klimeš J.; Bowler D. R.; Michaelides A. Van Der Waals Density Functionals Applied to Solids. Phys. Rev. B 2011, 83, 195131. 10.1103/PhysRevB.83.195131. [DOI] [Google Scholar]
- Jian-Min Z.; Fei M.; Ke-Wei X. Calculation of the Surface Energy of Fcc Metals with Modified Embedded-Atom Method. Chin. Phys. 2004, 13, 1082–1090. 10.1088/1009-1963/13/7/020. [DOI] [Google Scholar]
- Singh-Miller N. E.; Marzari N. Surface Energies, Work Functions, and Surface Relaxations of Low-Index Metallic Surfaces from First Principles. Phys. Rev. B 2009, 80, 235407. 10.1103/PhysRevB.80.235407. [DOI] [Google Scholar]
- Keene B. J. Review of Data for the Surface Tension of Pure Metals. Int. Mater. Rev. 2013, 38, 157–192. 10.1179/imr.1993.38.4.157. [DOI] [Google Scholar]
- Tyson W. R.; Miller W. A. Surface Free Energies of Solid Metals: Estimation from Liquid Surface Tension Measurements. Surf. Sci. 1977, 62, 267–276. 10.1016/0039-6028(77)90442-3. [DOI] [Google Scholar]
- Xin H.; Linic S. Communications: Exceptions to the d -Band Model of Chemisorption on Metal Surfaces: The Dominant Role of Repulsion between Adsorbate States and Metal d -States. J. Chem. Phys 2010, 132, 221101. 10.1063/1.3437609. [DOI] [PubMed] [Google Scholar]
- Caglar B.; Kizilkaya A. C.; Niemantsverdriet J. W.; Weststrate C. J. Application of Work Function Measurements in the Study of Surface Catalyzed Reactions on Rh(1 0 0). Catal., Struct. React. 2018, 4, 1–11. 10.1080/2055074X.2018.1434986. [DOI] [Google Scholar]
- Norskov J. K.; Abild-Pedersen F.; Studt F.; Bligaard T. Density Functional Theory in Surface Chemistry and Catalysis. Proc. Natl. Acad. Sci. 2011, 108, 937–943. 10.1073/pnas.1006652108. [DOI] [PMC free article] [PubMed] [Google Scholar]
- Walen H.; Liu D.-J.; Oh J.; Yang H. J.; Spurgeon P. M.; Kim Y.; Thiel P. A. Sulfur Atoms Adsorbed on Cu(100) at Low Coverage: Characterization and Stability against Complexation. J. Phys. Chem. B 2017, 122, 963–971. 10.1021/acs.jpcb.7b07046. [DOI] [PubMed] [Google Scholar]
- Andryushechkin B. V.; Zhidomirov G. M.; Eltsov K. N.; Hladchanka Y. V.; Korlyukov A. A. Local Structure of the Ag(100) Surface Reacting with Molecular Iodine: Experimental and Theoretical Study. Phys. Rev. B 2009, 80, 125409. 10.1103/PhysRevB.80.125409. [DOI] [Google Scholar]
- Feenstra R. M.; Hla S. W.. Introduction to Scanning Tunneling Microscopy of Metals and Semiconductor. In Physics of Solid Surfaces; Springer: 2015; pp 15. [Google Scholar]
- Lee S.; Park J.; Ragan R.; Kim S.; Lee Z.; Lim D. K.; Ohlberg D. A. A.; Williams R. S. Self-Assembled Monolayers on Pt(111): Molecular Packing Structure and Strain Effects Observed by Scanning Tunneling Microscopy. J. Am. Chem. Soc. 2006, 128, 5745–5750. 10.1021/ja058037c. [DOI] [PubMed] [Google Scholar]
- Ludwig R. How Does Water Bind to Metal Surfaces: Hydrogen Atoms Up or Hydrogen Atoms Down?. Angew. Chem., Int. Ed. 2003, 42, 3458–3460. 10.1002/anie.200301658. [DOI] [PubMed] [Google Scholar]
- Benedict W. S.; Gailar N.; Plyler E. K. Rotation-Vibration Spectra of Deuterated Water Vapor. J. Chem. Phys. 1956, 24, 1139–1165. 10.1063/1.1742731. [DOI] [Google Scholar]
- Thiel P. A.; Madey T. E. The Interaction of Water with Solid Surfaces: Fundamental Aspects. Surf. Sci. Rep. 1987, 7, 211–385. 10.1016/0167-5729(87)90001-X. [DOI] [Google Scholar]
- Henderson M. The Interaction of Water with Solid Surfaces: Fundamental Aspects Revisited. Surf. Sci. Rep. 2002, 46, 1–308. 10.1016/S0167-5729(01)00020-6. [DOI] [Google Scholar]
- Feibelman P. J. Partial Dissociation of Water on Ru(0001). Science 2002, 295, 99–102. 10.1126/science.1065483. [DOI] [PubMed] [Google Scholar]
- Shi Q.; Sun R. Adsorption Manners of Hydrogen on Pt(1 0 0), (1 1 0) and (1 1 1) Surfaces at High Coverage. Comput. Theor. Chem. 2017, 1106, 43–49. 10.1016/j.comptc.2017.02.024. [DOI] [Google Scholar]
- Iwasita T.; Xia X. Adsorption of Water at Pt(111) Electrode in HClO4 Solutions. The Potential of Zero Charge. J. Electroanal. Chem. 1996, 411, 95–102. 10.1016/0022-0728(96)04576-7. [DOI] [Google Scholar]
- Mohamed F.; VandeVondele J.; Hutter J.; Krack M.; Parrinello M.; Chassaing T. Quickstep: Fast and Accurate Density Functional Calculations Using a Mixed Gaussian and Plane Waves Approach. Comput. Phys. Commun. 2005, 167, 103–128. 10.1016/j.cpc.2004.12.014. [DOI] [Google Scholar]
- Feibelman P. J.; Bartelt N. C.; Nie S.; Thürmer K. Interpretation of High-Resolution Images of the Best-Bound Wetting Layers on Pt(111). J. Chem. Phys. 2010, 133, 154703. 10.1063/1.3488803. [DOI] [PubMed] [Google Scholar]
- Standop S.; Redinger A.; Morgenstern M.; Michely T.; Busse C. Molecular Structure of the H2O Wetting Layer on Pt(111). Phys. Rev. B 2010, 82, 161412. 10.1103/PhysRevB.82.161412. [DOI] [Google Scholar]
- Hammer B.; Nørskov J. K. Electronic Factors Determining the Reactivity of Metal Surfaces. Surf. Sci. 1995, 343, 211–220. 10.1016/0039-6028(96)80007-0. [DOI] [Google Scholar]
- Hammer B.; Norskov J. K. Why Gold Is the Noblest of All the Metals. Nature 1995, 376, 238–240. 10.1038/376238a0. [DOI] [Google Scholar]
- Gorzkowski M. T.; Lewera A. Probing the Limits of D-Band Center Theory: Electronic and Electrocatalytic Properties of Pd-Shell–Pt-Core Nanoparticles. J. Phys. Chem. C 2015, 119, 18389–18395. 10.1021/acs.jpcc.5b05302. [DOI] [Google Scholar]
- Fisher G. B.; Gland J. L. The Interaction of Water with the Pt(111) Surface. Surf. Sci. 1980, 94, 446–455. 10.1016/0039-6028(80)90018-7. [DOI] [Google Scholar]
- Jo S. K.; Kiss J.; Polanco J. A.; White J. M. Identification of Second Layer Adsorbates: Water and Chloroethane on Pt(111). Surf. Sci. 1991, 253, 233–244. 10.1016/0039-6028(91)90595-J. [DOI] [Google Scholar]
- Zhu B.; Xu Z.; Wang C.; Gao Y. Shape Evolution of Metal Nanoparticles in Water Vapor Environment. Nano Lett. 2016, 16, 2628–2632. 10.1021/acs.nanolett.6b00254. [DOI] [PubMed] [Google Scholar]
- Lee I.; Morales R.; Albiter M. A.; Zaera F. Synthesis of Heterogeneous Catalysts with Well Shaped Platinum Particles to Control Reaction Selectivity. Proc. Natl. Acad. Sci. 2008, 105, 15241–15246. 10.1073/pnas.0805691105. [DOI] [PMC free article] [PubMed] [Google Scholar]
Associated Data
This section collects any data citations, data availability statements, or supplementary materials included in this article.