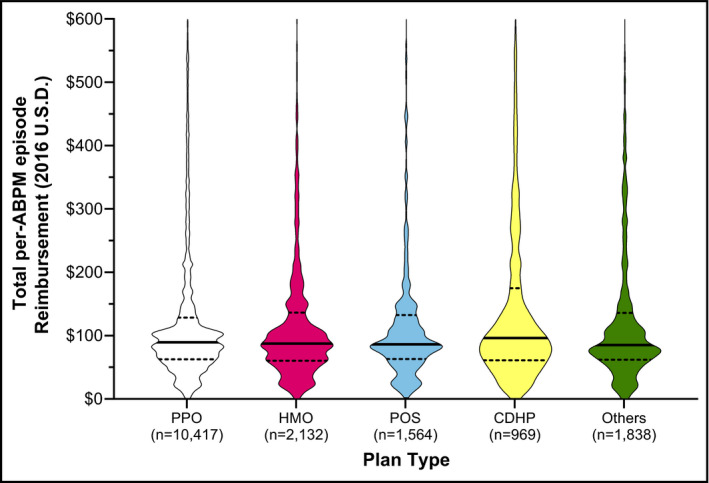
Figure 3.

Amount reimbursed per beneficiary for an entire ABPM episode (aggregated), stratified by benefit plan type. Data are represented in violin plots to display distribution of reimbursement amounts. Reimbursement amounts represent aggregated values for all ABPM codes submitted within a 1‐month period following the first ABPM claim submission. The dotted lines represent the 25th and 75th percentiles for reimbursement amount (ie, the interquartile range). The figures are displayed with a maximum y‐axis value of $600, and thus, a small number of outliers are excluded from the graphical representation but included in median and interquartile range calculations. CDHP, consumer‐directed health plan; HMO, health maintenance organization; POS, point of service; and PPO, preferred provider prganization. Others include basic/major medical, comprehensive, emergency operation plans and high‐deductible health plans
