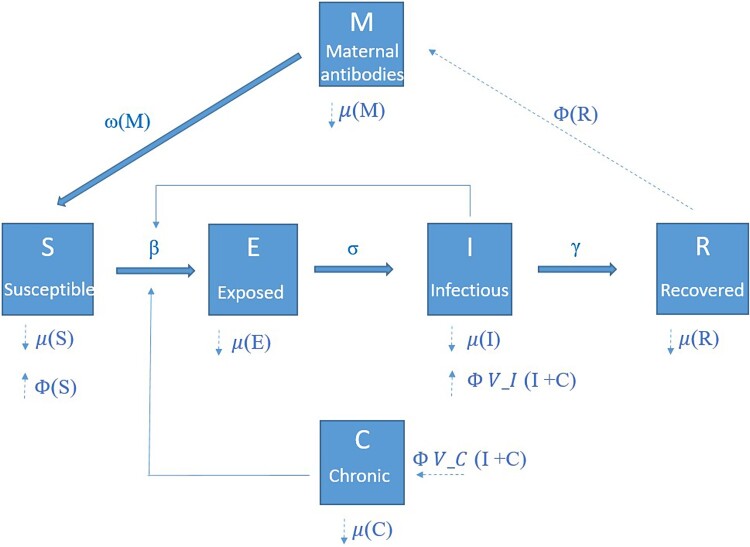
Figure 1.
Schematic illustration of the individual-based model used to simulate the spread of Lassa virus in populations of M. natalensis in Guinea. Individual rodents are assigned different states according to infection status: susceptible (S), exposed (E), acutely infectious (I), recovered (R), maternal antibody positive (M), and chronically infectious (C). State transition rates depend on the following parameters: transmission coefficient (β), latent period (σ−1), infectious period (γ−1), maternal antibody period (ω−1). Fat solid arrows indicate possible transitions between different states. The dashed lines show the demographic parameters: Φ (birth rate) and μ (mortality rate). The probability to become acutely infected after vertical transmission is given by V_I and to become chronically infected by V_C. Thin solid arrows indicate that the rate at which individuals move from one state to another depends on the number of individuals in another state.

