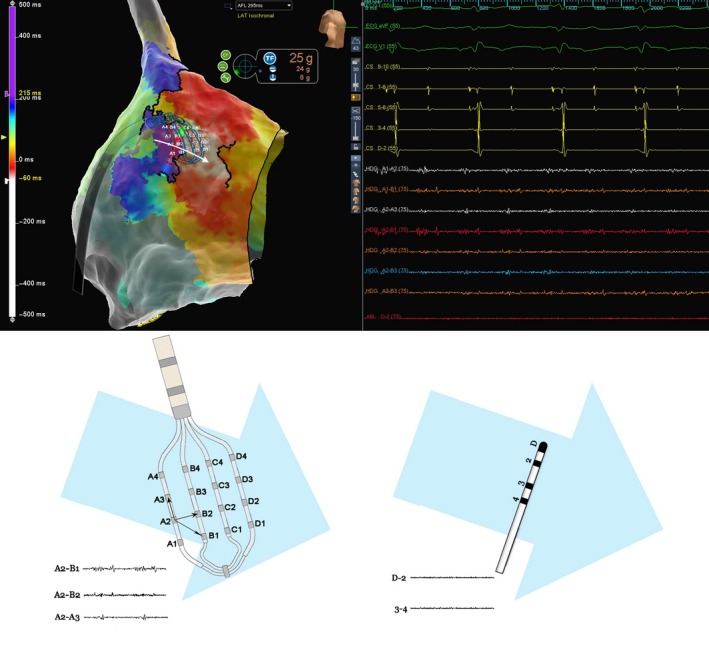
Figure 1.

(Above) Local activation timing map (left) of right atrium showing position of AdvisorTM HD Grid mapping catheter together with ablation catheter and wave front propagation (white arrow). The intracardiac electrogram is on the right. At the isthmus located at mid posterior lateral wall of right atrium, there was low‐amplitude, high frequency fractionated signal (amplitude: 0.07 ms) at diastolic phase which was clearly seen at A2‐B1 configuration, whereas no signal on ablation because of orientation of the ablation catheter that was prependicular to the wave front propagation. (Below) AdvisorTM HD Grid mapping catheter (left) showing activation wave front that were registered at A2‐B1 and A2‐B2 configuration (parallel to the wave front activation). Quadripolar catheter (right) showing no electrical signal registered because of the activation wave front that travels perpendicular to the catheter position. The scale of the amplitude (set at 75 as opposed to 55 by default) of both HD grid and ablation catheter is the same as shown in the intracardiac electrogram on top right
