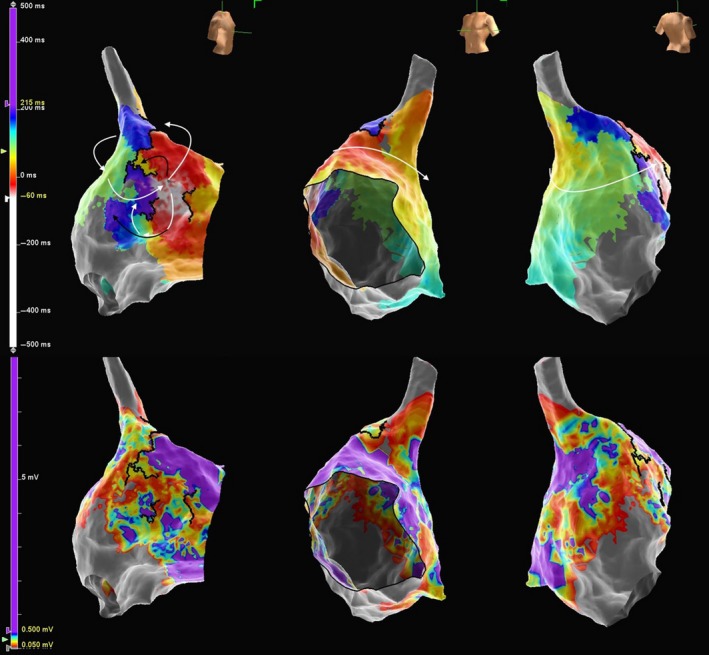
Figure 2.

(Above): Local activation timing map in RAO 30° cranial 15° (left figure), LAO 45° (middle figure) and PA view (right figure) of right atrium. The white arrow showed direction of the activation wave front. The dark arrow showed the activation wave front ended in blind loop. (Below) Voltage mapping of right atrium during sinus rhythm showed extensive low voltage zone in the posterior lateral of right atrium corresponded to the isthmus area. A total of 107 200 points collected and 4720 points being utilized
