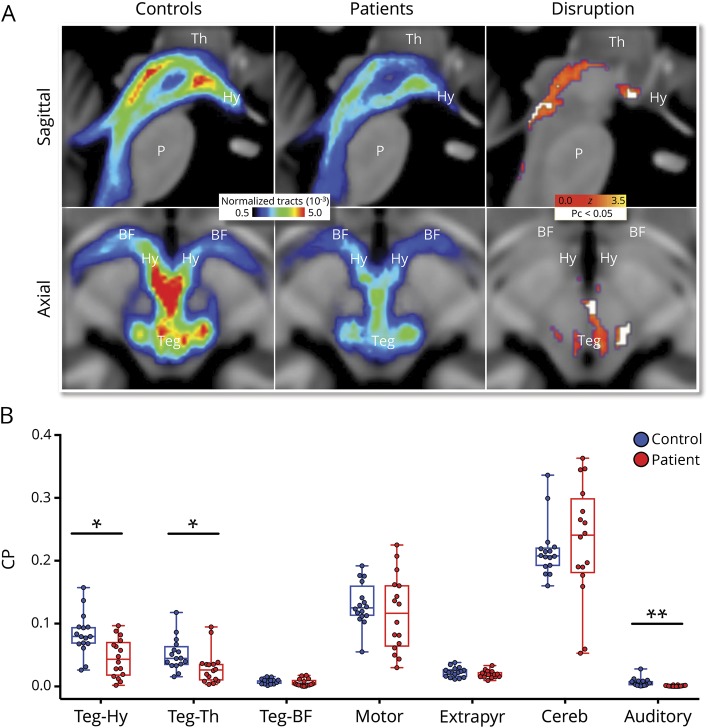
Figure 1. AAn connectivity in patients and controls.
(A) Sagittal (top row) and axial (bottom row) images of group median normalized tract numbers for pathways connecting the brainstem tegmentum (Teg) and a combined target including the hypothalamus (Hy), thalamus (Th), and basal forebrain (BF). In the third column, white voxels indicate regions with fewer normalized tracts in patients vs controls using a corrected pc < 0.05 (after Benjamini-Hochberg false discovery rate adjustment). Red/yellow correspond to z scores of all voxels with fewer normalized tracts using an uncorrected p < 0.05. (B) Patients show reduced connectivity probability (CP) relative to controls in 2 of 3 ascending arousal network (AAn) pathways (tegmentum-hypothalamus, tegmentum-thalamus) and 1 of 4 non-AAn pathways (auditory). Points represent individual participant CP values; boxes show median and interquartile ranges; and whiskers extend from maximum to minimum values. Cereb = cerebellar pathway; Extrapyr = extrapyramidal pathway; P = pons. *Holm family-wise error adjusted pc < 0.05, **pc < 0.005.

