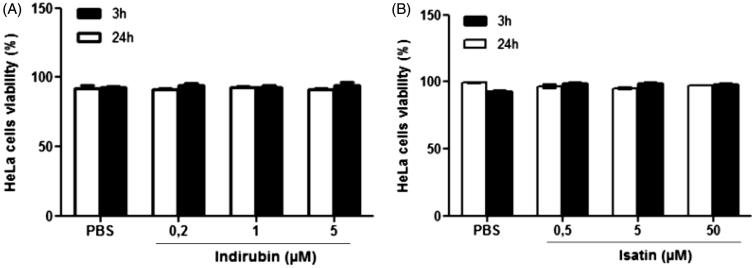
Figure 2.
Percentage of HeLa cell viability obtained in the Trypan blue exclusion test after 3 and 24 h of treatment with indirubin (A) and isatin (B). The asterisk indicates significant difference compared to the negative control group (p < 0.05, ANOVA followed by Tukey’s test). Each bar represents the mean ± standard deviation of the mean (X ± SD).

